This is Part 1 of a two part series on the production of 2016 Garbage Pail Kids Apple Pie. Part 2 can be found here.
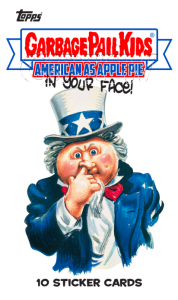 The 30th Anniversary Garbage Pail Kids set was highly anticipated from collectors. Topps saw the demand and produced a healthy amount of cards to go around. With the release of the 2016 GPK Apple Pie set would Topps follow suit, or change things around? We already know some of this information. Topps, while deciding to keep the large base set, completely changed the way parallels are done. They even started putting production numbers on many of the parallel sets. However, there is still a lot of information we can get by looking at sell sheet data, and pack odds.
First my disclaimer! Production numbers are never an exact science, and Topps makes it tough on us. In order to attempt to solve this riddle we need to look very closely at the clues in both the odds and the sell sheets. Some things to keep in mind for this post. 1) Topps doesn’t want the public to know exactly how much of each card was made. Why? No idea really, I think its dumb, but historically Topps only provides enough information to get close. 2) We need to make some assumptions. Those assumptions will be based on the clues we have, but still some guessing has to happen. 3) The odds never quite seem to come out completely equal. However we can round and get pretty close to how much was produced. 4) Topps changes what is printed from what the sell sheet says all the time. This will throw off all our numbers. 5) Keep in mind Topps historically holds back 5% of the print run to cover missing hits, damaged cards, and their No Purchase Necessary program. These numbers would include that 5%. With all that in mind let’s get started…(Warning lots of math coming up. If you don’t want to hear about the process, skip to the bottom for the answer sheet!)
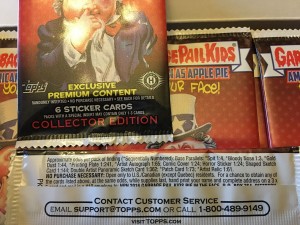 First we need to figure out how many packs were made for the entire print run. In order to do that we can only use a card type where the odds are exactly the same in Hobby, Collector, and Retail packs. This year there is only one type of card where that is the case, Gold Dust borders, at 1:44. In the past Topps would also keep Printing Plate odds the same throughout production, but they threw a bone to Collector packs this set, more on that in Part 2. Here’s what we know, there are 220 cards in the set. Gold Dust cards are numbered on the back this year to /50. Therefore, 220 cards X 50 number of golds per card = 11,000 total Gold Dust cards X 44 Odds = 484,000 total packs made for the release. Here’s our first point where things could go wrong. There is only 1 type of card where the odds are the same throughout all pack types, so there isn’t another way to double check our numbers. Topps could have held more Gold borders back, or maybe the odds were printed wrong. As I mentioned above, we have to use what we have available. After completely going through the numbers I’m confident this is a good starting point and has to be close to what was produced.
Now let’s try to figure out how many of each pack type was created for this release. Collector packs are always the easiest to figure out because they always contain cards that are exclusively made for the set. There are three inserts that are exclusive to Collector boxes; Artist Relics, Patches, and Duel Artist Sketch Cards.
- Artist Relics – 6 cards in set X 99 made per card = 594 total relics X 61 odds = 36,234 Collector packs made
- Patch Cards – 10 cards in set X 50 made per card = 500 total patches X 73 odds = 36,500 Collector packs made
- Duel Artist Sketches – 100 total sketches X 362 odds = 36,200 Collector packs made
As you can see really close numbers. Why don’t they match? Well, who knows really? Like I mentioned, the odds are never all exact, could be some rounding on Topps part. But the fact that all three are less than 300 packs apart, I think we have a good idea how many Collector packs were made. I’m going to go with the 36,500 number for our purpose throughout the rest of the post.
 Now lets move onto Hobby packs. We can figure out how many Hobby packs were made by looking at something that only Collector and Hobby packs have in common. We can use Die-cut sketches to figure out Hobby packs.
- So 36,500 Collector packs / 144 odds = 253 Die cut sketches in Collector packs.
- 500 total die-cut sketches – 253 = 247 die-cut sketches in Hobby packs
- 247 X 158 odds = 39,026 total Hobby packs produced
Let’s call that an even 39,000 for Hobby packs. Now that we’ve figured out Hobby/Collector production, let’s work on retail. Previously we determined there were 484,000 total packs produced. So we could simply go 484,000 total packs – 36,500 Collector packs – 39,000 Hobby packs = 408,500 total Retail packs produces. We can check our math by using another card type that is in both Hobby/Collector and Retail, the Artist Autographs. How many autos are there? 110 cards in set X 25 autos per card = 2750 total autos. Let’s see how the individual odds break that down with our pack totals we previously figured out.
- 36,500 Collector packs / 65 Odds = 561 autos in Collector packs
- 39,000 Hobby packs / 200 Odds = 195 autos in Hobby packs
- 2750 total autos – 561 Collector autos – 195 Hobby autos = 1994 autos in Retail packs
- 1994 Retail autos X 200 odds = 398,800 Total retail packs.
398,800 and 408,500 are pretty close considering the large number of packs. This is one of the reasons why I’m confident we are on the right track with the production numbers for the set. I’m going to go with 408,500 total Retail packs as the number we use going forward.
 Usually I’d be happy just getting these numbers. In the past its been impossible to figure out how many different types of retail packs; gravity, retail, blaster, jumbo, blister, etc. Topps produces. However, this time Topps did something interesting. They added a different type of sketch into Blaster boxes, and Jumbo packs. Therefore, we are able to determine for the first time how many Jumbo and Blaster packs were produced.
100 total Panoramic Sketches X 401 odds = 40,100 total Jumbo packs produced.
250 total Loaded Sketches x 68 odds = 17,000 total Blaster boxes X 4 packs per box = 68,000 total Blaster packs produced.
That’s going to leave us with…
408,500 total retail packs – 80,200 Jumbo pack equivalent (Topps considers Jumbo packs as 2 packs in the odds, so we need to double this number as the total retail pack numbers represents total 10 card packs.) = 328,300 – 68,000 Blaster packs = 260,300 Retail packs left. Unfortunately, we can’t breakdown the retail packs any further. The 260,300 represents Gravity feed, Regular Retail, and Blister packs. There is just not enough information in the odds or sell sheets to go any further.
Here’s the bottom line. I’m pretty confident that these numbers are close. Here is what I believe to be the production for each type of pack:
- Total Production – 484,000 Packs
- Hobby – 39,000 Hobby Packs or 1625 Hobby boxes or 203 Hobby Cases
- Collector – 36,500 Collector Packs or 1520 Hobby Boxes or 190 Collector Cases
- Retail – 408,500 Retail Packs
- Jumbo Retail – 40,100 Jumbo Packs
- Blaster Boxes – 68,000 Blaster Packs or 17,000 Blaster Boxes
(Once again my numbers could be off. We had to make some assumptions and trust the sell sheets and odds. But I’m confident these numbers are really close.)
So what does this all mean? What stands out to me as surprising or interesting after running the numbers? First off, WOW!, they print a whole lot of retail product. There is almost the same number of Blaster packs as Hobby and Collector combined! More Jumbo packs than either Hobby or Collector packs. There is going to be retail on store shelves for months.
The other thing that stood out to me right away is production is down compared to the 30th set. In fact its down quite a bit. Let’s compare the two looking back at the numbers we figured out for the 30th set:
Total Pack Production: 30th – 669,000 packs \ Apple Pie – 484,000 packs (27.7% decrease in production)
Hobby Pack Production: 30th – 51,000 packs \ Apple Pie – 39,000 packs (23.5% decrease in production)
Collector Pack Production: 30th – 41,000 packs \ Apple Pie – 36,500 packs (11.0% decrease in production)
Retail Pack Production: 30th 577,000 packs \ Apple Pie – 408,500 packs (29.2% decrease in production)
Topps prints to order their product. Which means based on distributor pre-orders Topps decides how much product to produce. Its obvious the demand isn’t the same for the new set compared to the 30th set. This gives you a good idea how much, almost a 30% decline in production. Something interesting however, Collector production only fell by 11%, its clear collectors enjoy busting collector packs. Its also clear collectors don’t want Hobby boxes. Since the debut of Collector boxes, Topps has made Hobby box odds almost similar to Retail odds, and collectors are responding. One other thing to wonder, did the large decrease in retail orders cause Topps to increase the inserts and hits in retail product this year?
All fun stuff to think about as you bust into those new packs! Let me know your thoughts on the numbers in the comments!
This is Part 1 of a two part series on the production of 2016 Garbage Pail Kids Apple Pie. In Part 2 we will look at production numbers for all parallel and insert sets. Part 2 can be found here.
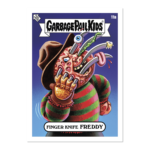
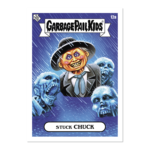
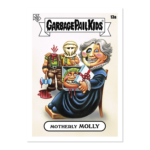
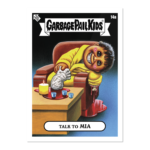
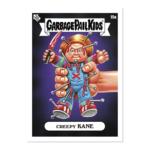
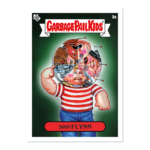
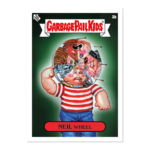
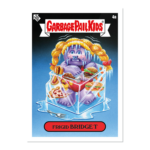
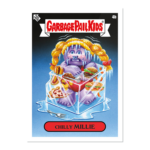
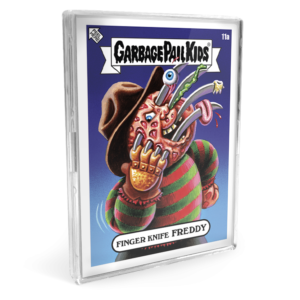 We are now half way through the horror GPK releases. Today Topps launched 2024 Garbage Pail Kids Oh the Horror-ible week 3. Once again, this week’s set contains 10 cards, 5 new characters in a/b versions. All artwork for this week’s set was done by Brent Engstrom. Each set purchased also comes with either a B&W Wrapper or Gold Foil /25 Wrapper card. Sets can be purchased for $19.99 or in a lot of 10 for $179.99. Shipping is free when choosing the economy option. The set will be available for 7 days on Topps.com. Topps will reveal the print run at the end of the sale. Here is this week’s checklist along with pictures of the cards.
