
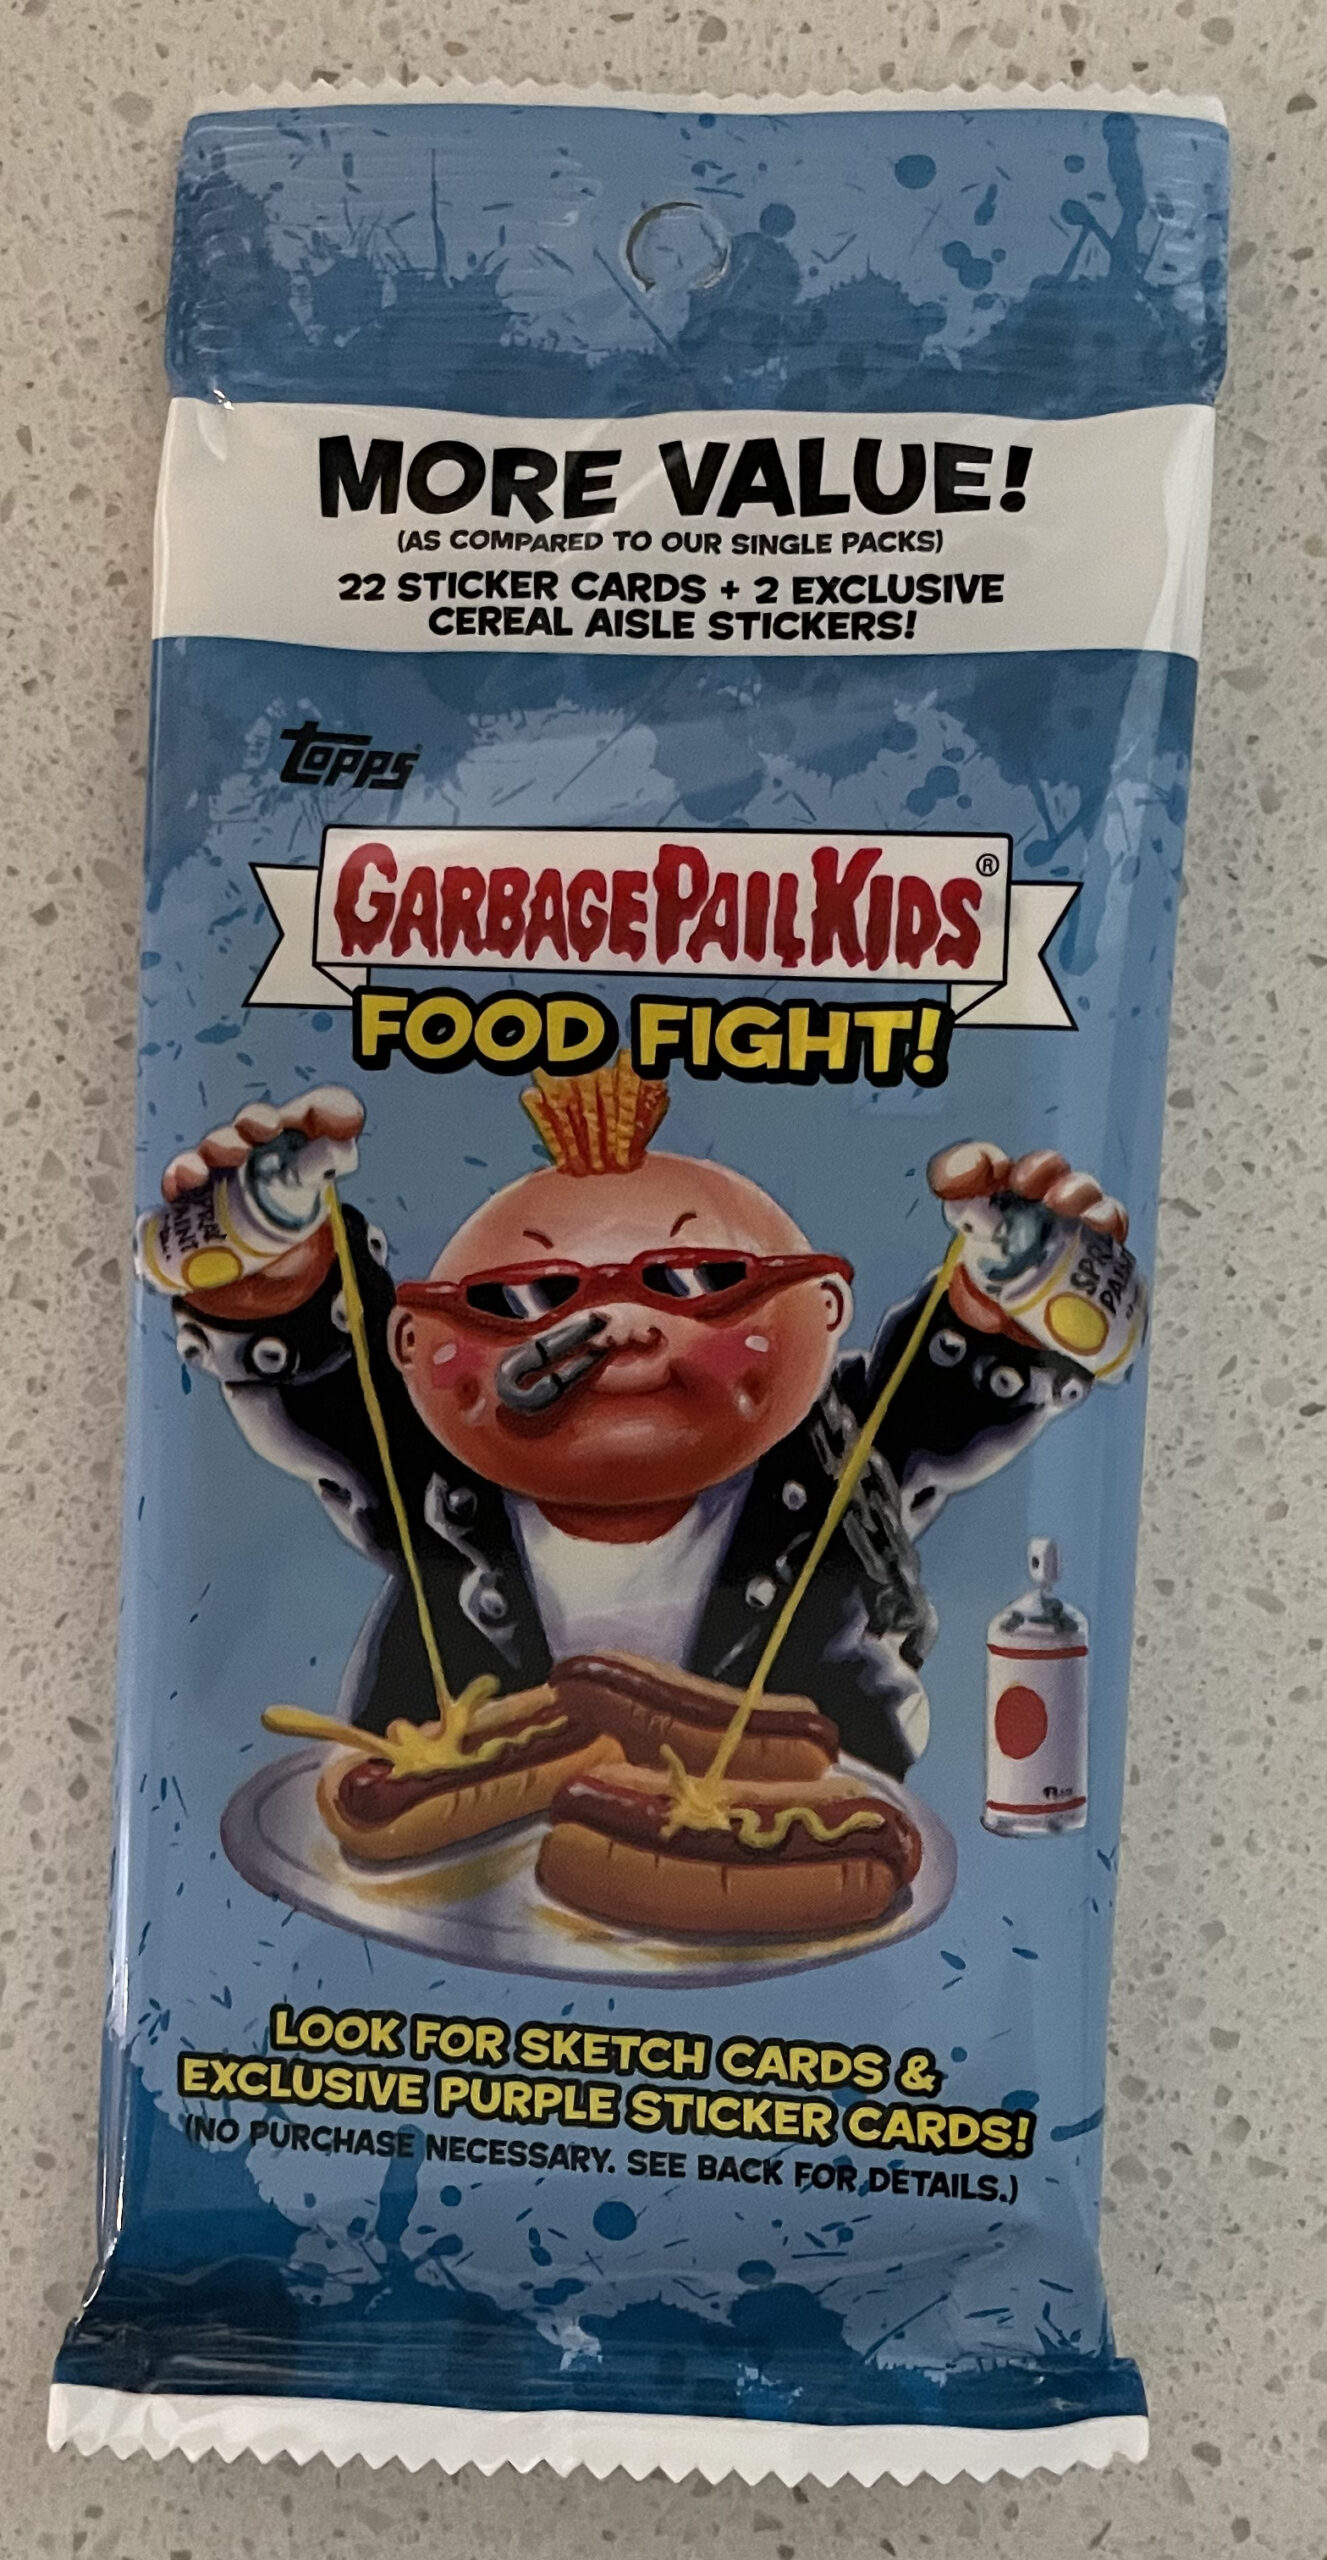
This is Part 2 of a two part series on the production of 2021S1 GPK Food Fight. If you missed Part 1 you can go here to catch up.
 In the first post we looked at how many packs/boxes/cases were produced of 2021S1 Garbage Pail Kids Food Fight. Here’s a review of what we came up with.
- Total Production – 1,790,000 Packs
- Collector –225,000 Collector Packs or about 9,375 Collector Boxes or about 1,171 Collector Cases
- Total Retail – 1,564,000 Packs
- Retail Display – 356,000 Retail Display Packs or about 14,833 RD Boxes or about 1,854 RD Cases
I’ll be using these numbers to try to come up with an idea how many of each type of parallel and insert were created for the set. This will give you a good idea how rare a set is and how quickly you need to snap up that card for your rainbow! I’ll also compare some of this info to the previous sets for reference. As a reminder, in addition to using the sell sheet and odds, we will also have to make some assumptions and flat out guesses when trying to figure some of these out.
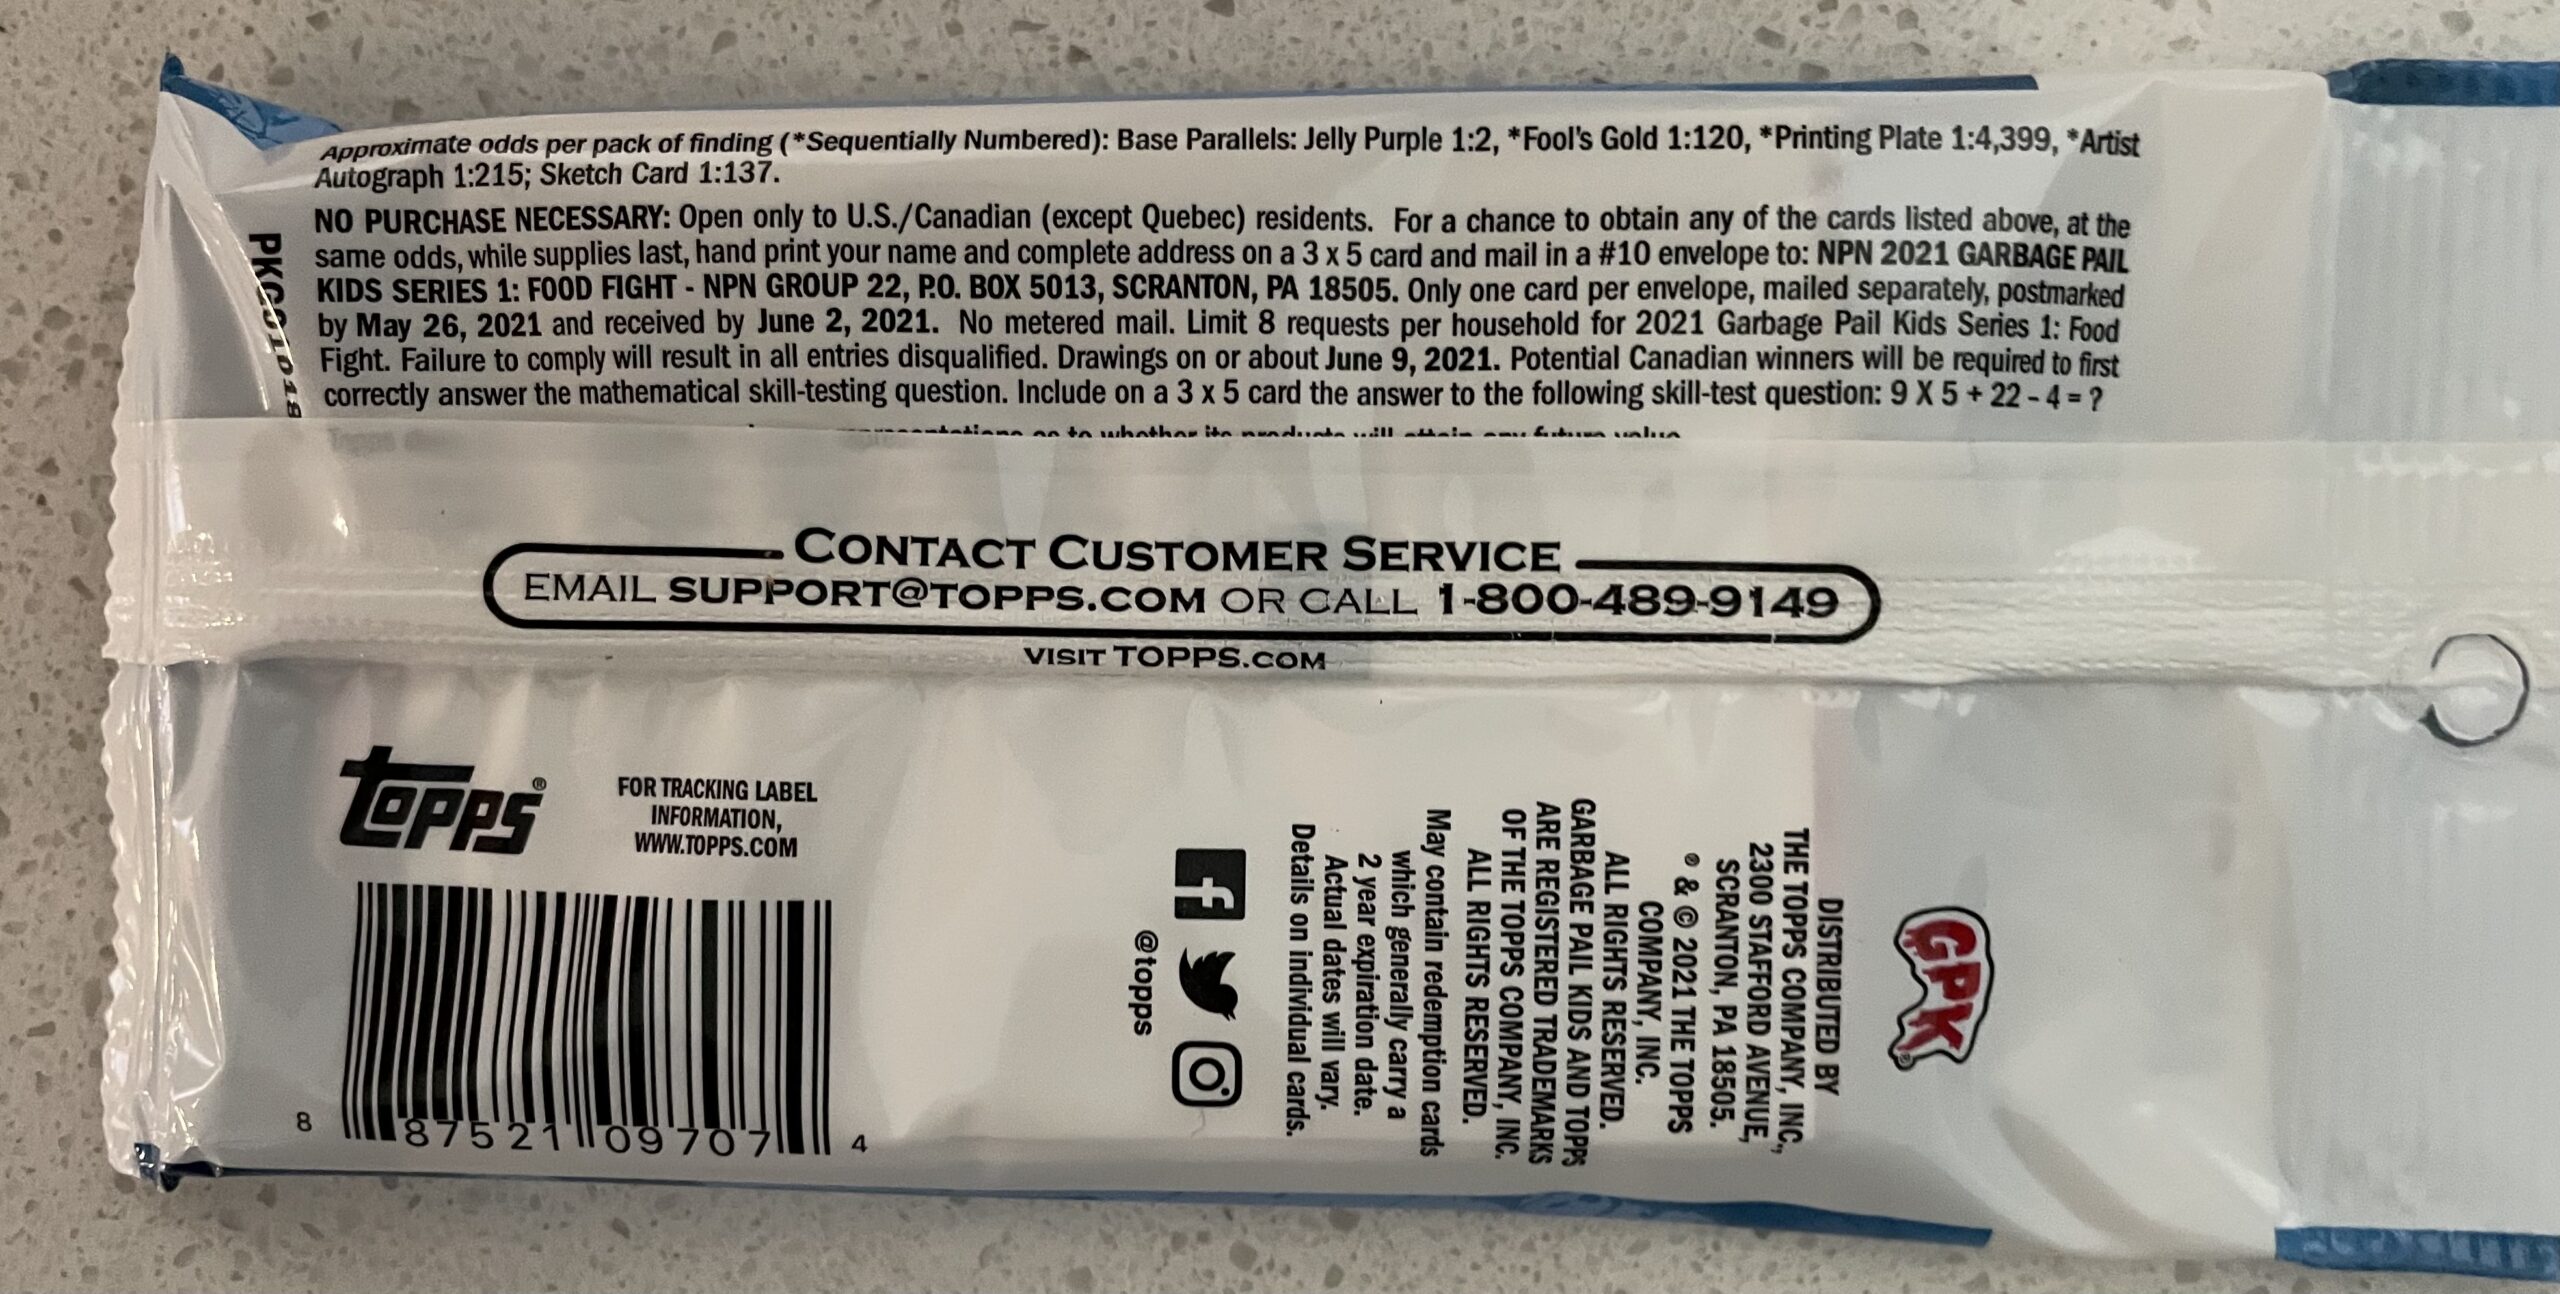 So how many of each type of card was made? We can’t figure it out for every type of insert or parallel. Some card types we don’t have enough information. Other times however, Topps is nice enough to tell us exactly how many of a card was produced. Like previous sets, Topps has continued to number many card types. This means we already know most of the parallel and insert numbers already! Makes this post a lot easier! We know Blue /99, Red /75, and Gold /50 for the parallels, and Relics /199 and Autos /80. There were a few changes in this set, compared to the 35th set. Auto print runs are significantly higher, Golds moved back to /50, while Patches are slightly less.
First let’s figure out production for a couple parallels.
- Black Borders – 225,000 Collector packs / 1 Odds (doh) = 225,000 total Black borders / 200 cards in set = 1,125 per card.
- Green Borders – 1,564,000 Retail packs / 1 Odds (doh) = 1,564,000 total Green borders / 200 cards in set = 7,840 per card.
 A lot to discuss with the the parallels. First off, because we are unable to break out Blaster and Fat Pack production numbers, we are unable to figure out Yellow and Purple print runs for this set. It’s safe to assume the print runs are approximately the same percent higher than their 35th counterparts as the packs are. Likewise, the Green numbers above aren’t as accurate as I would like, because we don’t have Fat Pack production. Again, Fat Packs are being counted as 3 packs, but each fat pack comes with only 2 green parallels. The actual number is slightly less, but you get the idea, there are a ton of each green border out there. Black parallels are also much higher due to the increased Collector print run.
Now let’s take a look at the various insert sets.
- GPK Wacky Package – 225,000 Collector packs / 24 odds = 9,375 total GPK Wacky Package / 10 cards in set = 937 per card
- Magnet Cards – 225,000 Collector packs / 24 odds = 9,375 total Magnets / 12 cards in set = 781 per card
- You Are What You Eat – 356,000 Retail Display Packs / 3 odds = 118,666 total YAWYE / 10 cards in set = 11,866 per card
- Large Fridge Tins – 9,375 Collector Cases = 9,375 Large Fridge Tins
The first insert we should talk about are the GPK Wacky Packages. According to the odds above, there should be well over 900 of each card. However, based on the breaks that have been observed, the GPK Wacky’s are only falling in approx 15% of Collector boxes. If this holds true, and the remaining Wackys never surface, it’s reasonable to think there are only 140-150 of each GPK Wacky actually out there. Also, like with the parallels above, because we are unable to break out the production numbers for Blasters and Fat Packs, we are unable to determine how many Cereal Aisle and Celebrity Chef inserts were made.
The numbers we are able to figure out all tell the same story, parallels and inserts are up considerably because production is up. Another interesting thing to look at is the distribution of the “hits” in the various pack types. Just by looking at the retail odds, it’s clear the odds for “hits” are higher than they have ever been, much higher than any other set. Why is this? Topps increased production on Collector boxes, and each box is guaranteed a hit. With Parches actually being less this set, and only a few more sketches, Topps has to move a large percent of autos and plates to Collector boxes. Not only were they moved, but auto print run had to be raised to /80 to accommodate the hits. Collectors will notice the majority of hits from a Collector case will be autos. Just how many plates and autos are in Collector vs. Retail packs?
- Collector packs 225,000 / 40 auto odds = 5,625 autos in Collector packs
- 200 base cards * 80 autos per card = 16,000 total autos – 5,625 autos in Collector = 10,375 autos in retail
- Collector packs 225,000 / 796 Plate odds = 282 plates in collector packs
- 400 total plates – 282 in collector packs = 118 in retail packs
There are about 35% of the autos and a whopping 70% of printing plates in Collector Packs. That’s a lot when you consider Collector packs only make up 12% of the total production run. So if you are wondering why the odds are so long in retail packs, you can blame Collector Boxes for the results.
The bottom line is once again, Garbage Pail Kids are seeing huge production increases into 2021. GPKs are not immune to the huge increases in demand for card collectibles since the Covid-19 pandemic started. Not only has there been an increase of new collectors, but the large influx of sport card sellers looking to capitalize on the current GPK demand is causing numbers to sights unseen in decades. The question now is how high can the demand go? Will we see continued increases with sets later in 2021?
Finally, can we figure out how many base cards were produced? Not really, but we can use what we know and give it our best guess! We know Collector packs have 6 or 7 base cards per pack, except for packs containing a patch card. Retail packs also have 6 or 7 base cards per pack. We will go with 7 for each pack. While we can’t break out Fat Packs this series, the less base cards even themselves with Collector and Retail packs that have 6 cards.
Base Cards – 1,790,000 total packs produced * 7 per pack = 12,530,000 Total Base Cards produced / 200 cards per set = 62,650 Total of each base card.
Over 12 million base cards printed!! We’ve hit 8 digits! Once again, by far the highest produced set since Topps has been supplying odds for packs. While I have no way of knowing for sure, I suspect these numbers are only surpassed by OS print numbers. How high can they go?
This is Part 2 of a two part series on the production of 2021S1 GPK Food Fight. If you missed Part 1 you can go here to catch up.