
This is Part 1 of a 2 part series on the production of 2019 Series 2 Garbage Pail Kids Revenge of Oh the Horror-ible. Part 2 will be posting soon.
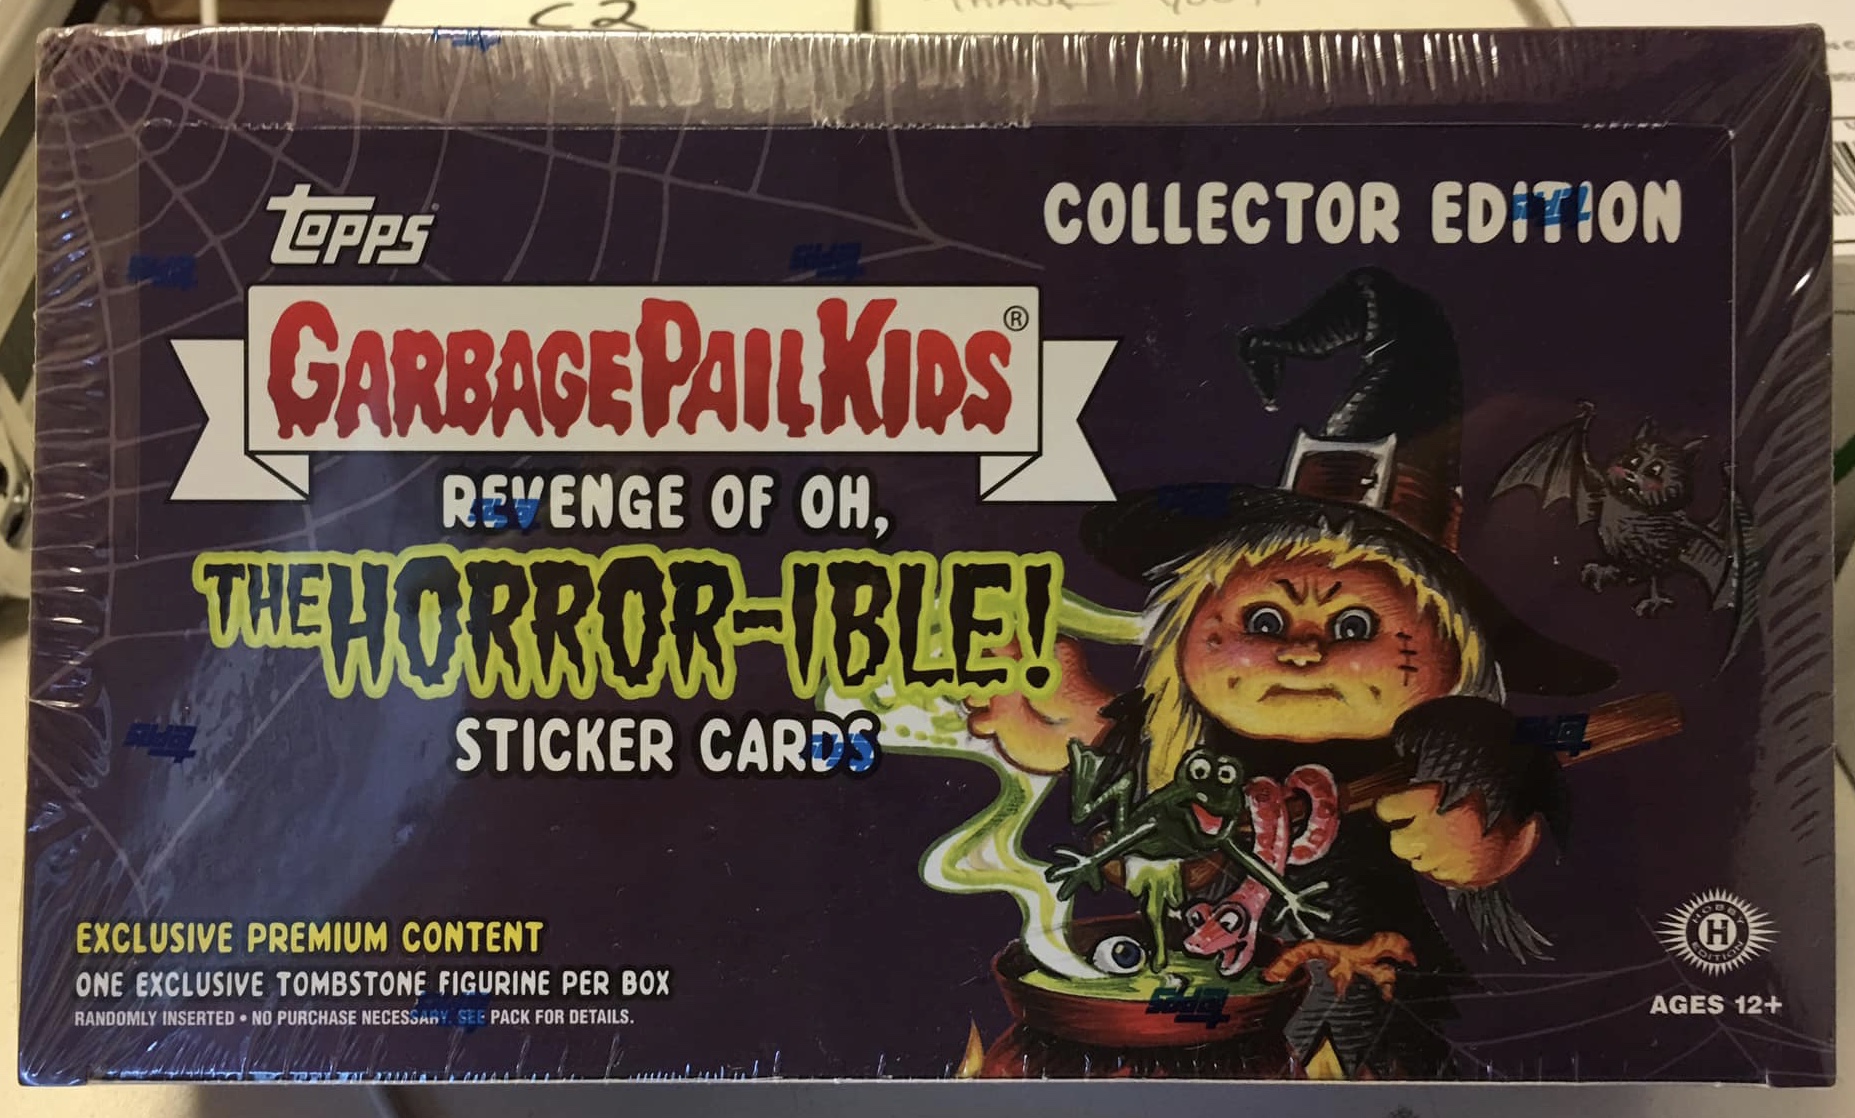 Last year’s 2018S2 Oh the Horror-ible was a very successful set for Topps. GPK fans tend to lean towards the horror genre, and that showed with a very good selling set. In fact it sold so well it caused production of 2019S1 We Hate the 90’s to increase slightly, especially with retail. What should have been expected by collectors, but still comes as a shock, the newest set 2019S2 Revenge of Oh the Horror-ible production is much higher. While that’s bad for collectors looking to pull hits from packs, its good for the brand as it shows when the art and gags are well done, it will sell. Just how high did Topps raise the production? Let’s dive into the numbers and see where things stand.
First my disclaimer! Production numbers are never an exact science, and Topps makes it tough on us. In order to attempt to solve this riddle we need to look very closely at the clues in both the odds and the sell sheets. Some things to keep in mind for this post. 1) Topps doesn’t want the public to know exactly how much of each card was made. Why? No idea really, I think its dumb, but historically Topps only provides enough information to get close. 2) We need to make some assumptions. Those assumptions will be based on the clues we have, but still some guessing has to happen. 3) The odds never quite seem to come out completely equal. However, we can round and get pretty close to how much was produced. 4) Topps changes what is printed from what the sell sheet says all the time. This will throw off all our numbers. 5) Keep in mind Topps historically holds back up to 5% of the print run to cover missing hits, damaged cards, and their No Purchase Necessary program. These numbers would include that 5%. With all that in mind let’s get started…(Warning lots of math coming up. If you don’t want to read about the process, skip to the bottom for the answer sheet!)
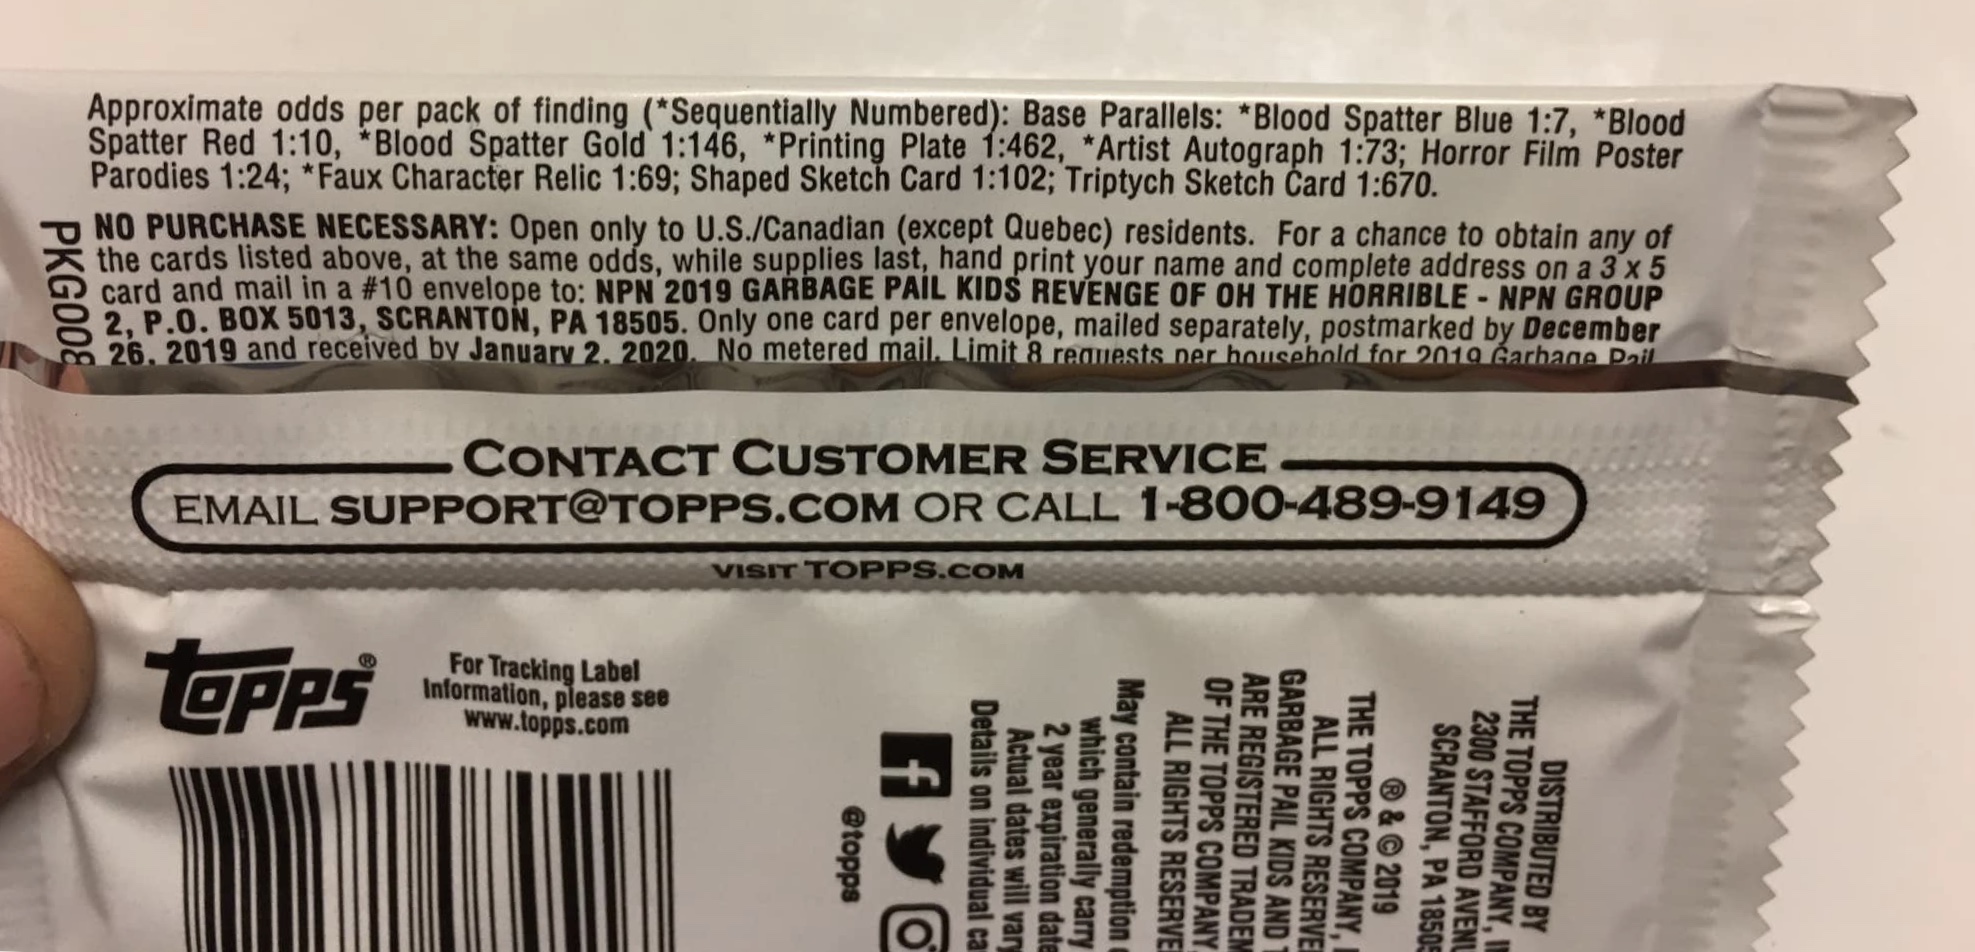
To start we need to determine how many packs were made for the entire print run. In order to do that we need a card type where all the odds are exactly the same in Collector and Retail/Hobby packs. In the past this was easy. Historically, Topps has used the same exact odds for both the Gold borders and the Artist autographs. With this set, like We Hate the 90’s, there are all kinds of problems with the odds printed in the packs. First off, odds for the parallels are at least overstated by double. This has happen before on GPK packs. This is especially true with the Gold borders. Based on actual pulls coming from multiple cases, I’m confident in saying Golds are falling at twice the rate of the odds in all pack types. Going forward in this article I will be citing the parallels odds 1/2 of what’s printed on the packs. The problem we run into is the odds on Fat Pack. In the past I’ve always counted a Fat pack as 2 retail packs. The odds seemed to lean that way. However, something interesting with this release. The odds for fat packs are 1/3 of the odds on retail packs for gold borders, autos, and even printing plates. It does make sense now. With regular packs being 8 cards, Fat Packs are now 24 cards. Now of course 5 of the cards in the fat pack are inserts or parallels, but they are closer to 3 retail packs than 2. So going forward I’m going to count Fat packs as 3 retail packs in calculations. Just know that because of the number of inserts, the numbers for Fat packs will be a little higher than they really are.
Gold borders this time are set at 1:146/1:145 packs in Collector, Retail, and Blaster packs, and 1:49 in Fat packs. Since the odds are overstated by double I’m going to use 1:73 as the more realistic odds. There are 200 base cards in the set, and Gold borders are /50 on the back. Therefore, 200 X 50 number of golds per card = 10,000 total Gold borders X 73 odds = 730,000 total packs made for release. Holy %$&*$ that’s a lot of cards!
 How can we be sure 730,000 is the right number? It’s hard because Topps no longer has any other card types with similar odds across the packs. Instead let’s try to reverse check our number and see if it makes sense. Let’s try to figure out how many of each pack type there are. Collector packs are always easy. There are a lot of card types only found in Collector packs. Relics, Red borders, Blue borders, and shaped sketches are all things we can use. Let’s look at the math on those:
- Patch Cards – 10 cards in set X 100 made per card = 1000 total patches x 69 odds = 69,000 Collector packs made
- Bloody Red borders – 200 cards in set X 75 made per card = 15,000 total Red borders X 5 odds = 75,000 Collector packs made
- Spit Blue borders – 200 cards in set X 99 made per card = 19,800 total Blue borders X 3.5 odds = 69,000 Collector packs made
- Shaped sketches – 51 artists * 12 sketches each = 612 total shaped sketches * 102 odds = 62,424 Collector packs made
Once again Collector boxes are pretty easy to figure out. Sure the blue borders show a few more packs, but quite often the odds are rounded and not exact. That could account for some of the differences. It looks like its safe to assume 69,000 Collector packs were made. This shows a sharp increase in production of Collector packs. It makes sense, collectors bought the first Horror-ible release, and this one sold even better.
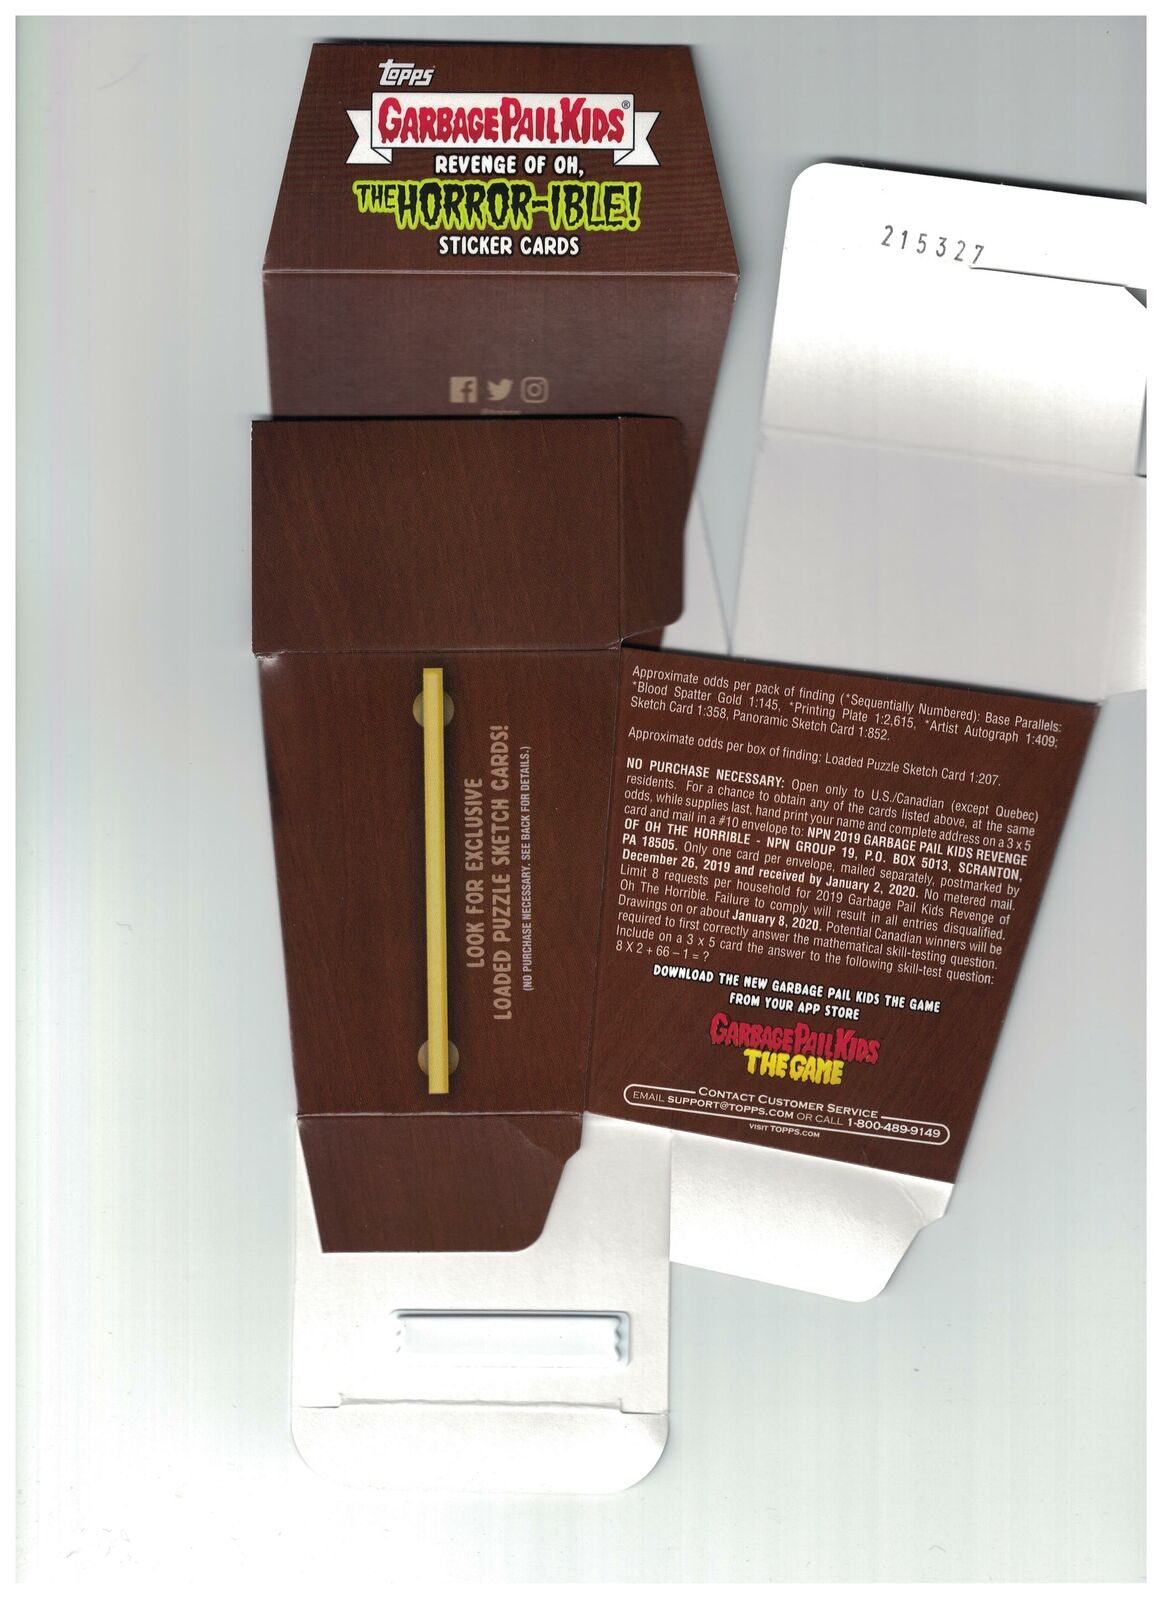
How about other pack types? In order to determine how many different types of retail packs were made, we would need a card type that is only in one type of retail pack, and we know how many were made. In the past this has been near impossible. The only card types that are individual to retail packs are Loaded Sketches and Panoramic Sketches. While Topps doesn’t release the number of sketches inserted, we have a good idea. Sketch artists were asked to do 5 Loaded and 3 Panoramic sketches. We also know, based on the Topps checklist, that there were 51 sketch artists this series. In the past a multitude of factors didn’t allow me to use these numbers. Some times artists didn’t complete their sketches, or many were rejected by Topps, or Topps’ odds were just way off what makes sense. Let’s see what the numbers show.
- Loaded sketches – 51 artists * 5 sketches each = 255 total Loaded sketches * 207 odds per box = 52,785 Blaster boxes * 5 packs per box = 263,925 blaster packs
- Panoramic sketches – 51 artists * 3 sketches each = 153 total pano sketches * 852 odds = 130,356 Fat packs
 A lot of things to note on these numbers. Odds for Panoramic sketches show up on Blaster packs for some reason, in addition to Fat packs. So far I’ve only seen Panoramic sketches come out of Fat packs. The change to move Panos to Blaster packs isn’t suppose to happen until the next series. I fully believe the Pano odds on the Blaster packs are a mis-print, and they aren’t in there. If they are in there, it completely throws the odds off, which is another reason I think its s mis-print. If we are going to count each Fat pack as 3 retail packs that makes those 391,068. Yozzers! Those are huge numbers for each pack type, especially when compared to previous releases. However based on actually pull rates of sketches, plates, and autos from packs the numbers make sense. I’m going to round both of those numbers. Let’s use 264,000 Blaster packs, and 391,00 adjusted Fat packs.
We know there are 69,000 Collector packs. If total packs are 730,000 – 69,000 Collector packs = 661,000 retail packs. Let’s take it even further. 661,000 retail packs – 264,000 blaster packs – 391,000 Fat packs = 6,000 Retail Display packs. Ok wait a second, that doesn’t make sense. But let’s think about Retail Display boxes. They aren’t sold in stores. The only way to get them is from online retailers or Topps.com. So far Topps.com hasn’t posted them for sale. Previous series I estimated only 43,000. Maybe they weren’t ordered in any large quantities? I’ve seen very few Retail Display boxes being busted online so far. Do I think there were only 6,000 Retail Display packs? No I don’t, I’m sure there are more. But remember my estimate of counting each Fat pack as 3 is an over estimate. With production being so high on those, that could easily account for the missing Retail Display packs. Let’s look at regular sketch cards in a different way. If the odds are correct on the Loaded and Pano sketches we can figure out how many regular sketches are in each pack type. 51 artists were asked to do 37 regular sketches each. That comes out to 1887 total regular sketches.
- Fat Packs 130,000 / 120 odds = 1083 regular sketches in Fat Packs
- Blaster Packs 264,000 / 358 odds = 737 regular sketches in Blaster Packs
- 1887 total regular sketches – 1083 sketches in Fat packs – 737 sketches in blaster packs = 67 sketches in Retail Display packs * 358 odds = 23,986 Retail Display packs
This way of doing it gives us a more realistic Retail Display number. Roughly 24,000 packs is less than previous sets, but makes more sense than 6,000 packs. If we use 24,000 for Retail packs, then we get 264,000 Blaster + 391,000 Fat + 24,000 Retail = 679,000 total retail packs. This is a little more than what we came out with above at 661,000. This is most likely because using a 3x multiplier for Fat packs is slightly too much. So which numbers should we use? For the rest of this article and the next, I’m going with 391,000 for Fat packs, and 24,000 for Retail Display packs. This also changes our total pack number to 748,000. Just know the Fat pack number is a slight over estimate. Another interesting thing to look at with regular sketches. 51 artists * 37 regular sketches each = 1887 total sketches * 358 odds across retail = 675,546 retail packs. Thats right there with the 679,000 number we came up with. I’m confident that the total pack number is very close.
What do the numbers tell us? Topps cranked the presses for this set. Heck they might still be running. I’m fairly confident we can use the total pack number of 748,000. Topps makes it really tough to get an accurate number. Life would be a lot easier if they revealed more.
Here’s what I believe the total production numbers to be for We Hate the 90’s:
- Total Production – 748,000 Packs
- Collector – 69,000 Collector Packs or about 2,875 Hobby Boxes or about 360 Collector Cases
- Blaster – 264,000 Blaster Packs or 32,800 Blaster boxes or 1,320 Blaster Cases
- Fat Packs – 130,000 Fat Packs or 1203 Fat Pack cases
- Retail Display – 24,000 Retail Display Packs or 1000 Retail Display boxes or 125 Retail Display Cases
Production is not only up, but it’s up huge. Retail partners, including the folks that stock Target, saw how well 2018S2 Oh the Horror-ible sold, and ordered accordingly. Can the market sustain that many cards? Only time will tell. We won’t know until we see any steep discounts at online merchants many months down the line. How does production stack up against recent sets?
- Total Pack Production
- We Hate the 80’s – 439,000
- Oh the Horror-ible – 440,000
- We Hate the 90’s – 473,000
- Revenge of Oh the Horror-ible – 748,000 (37% increase in production vs. We Hate the 90’s)
- Collector Pack Production
- We Hate the 80’s – 39,000
- Oh the Horror-ible – 60,000
- We Hate the 90’s – 50,000
- Revenge of Oh the Horror-ible – 69,000 (28% Increase in Collector production vs. We Hate the 90’s)
- Retail Pack Production
- We Hate the 80’s (Includes Hobby packs) – 393,000
- Oh the Horror-ible – 380,000
- We Hate the 90’s – 423,000
- Revenge of Oh the Horror-ible – 6579,000 (38% increase in Retail/Hobby production vs. We Hate the 90’s)
Since I’ve been running this website and figuring out production numbers, this is the highest produced GPK set to date. This even beats the 30th anniversary set. This is why when you are busting packs you aren’t pulling any big hits. The sketches, plates, and autos are very hard to pull. This frustrates collectors who have been more use to easier pulls the previous years. On the other side of the coin, this shows fantastic growth for the GPK brand within Topps. Just look at the number of officially licensed merchandise being launched by numerous companies. Topps has successfully got the GPK brand name out in public. That in conjunction with the Horror theme of the set, has proven to be a hit. What will be fascinating to see is how demand for this set will result in sales for 2020S1 Late to School. Demand for GPK has not been this high in years. Will the trend continue into 2020?
This practice is always a lot of fun to look at. Let me know your thoughts on the numbers in the comments!
This is Part 1 of a 2 part series on the production of 2019 Series 2 Garbage Pail Kids Revenge of Oh the Horror-ible. In Part 2 we will look at production numbers for all parallel and insert sets. Part 2 will be posted soon.
Pingback: How Many 2019S2 GPK Revenge of Oh the Horror-ible Were Produced? Part 2 | GPKNews.com