
This is Part 1 of a two part series on the production of 2018 Garbage Pail Kids We Hate the 80’s. Part 2 will be posting soon.
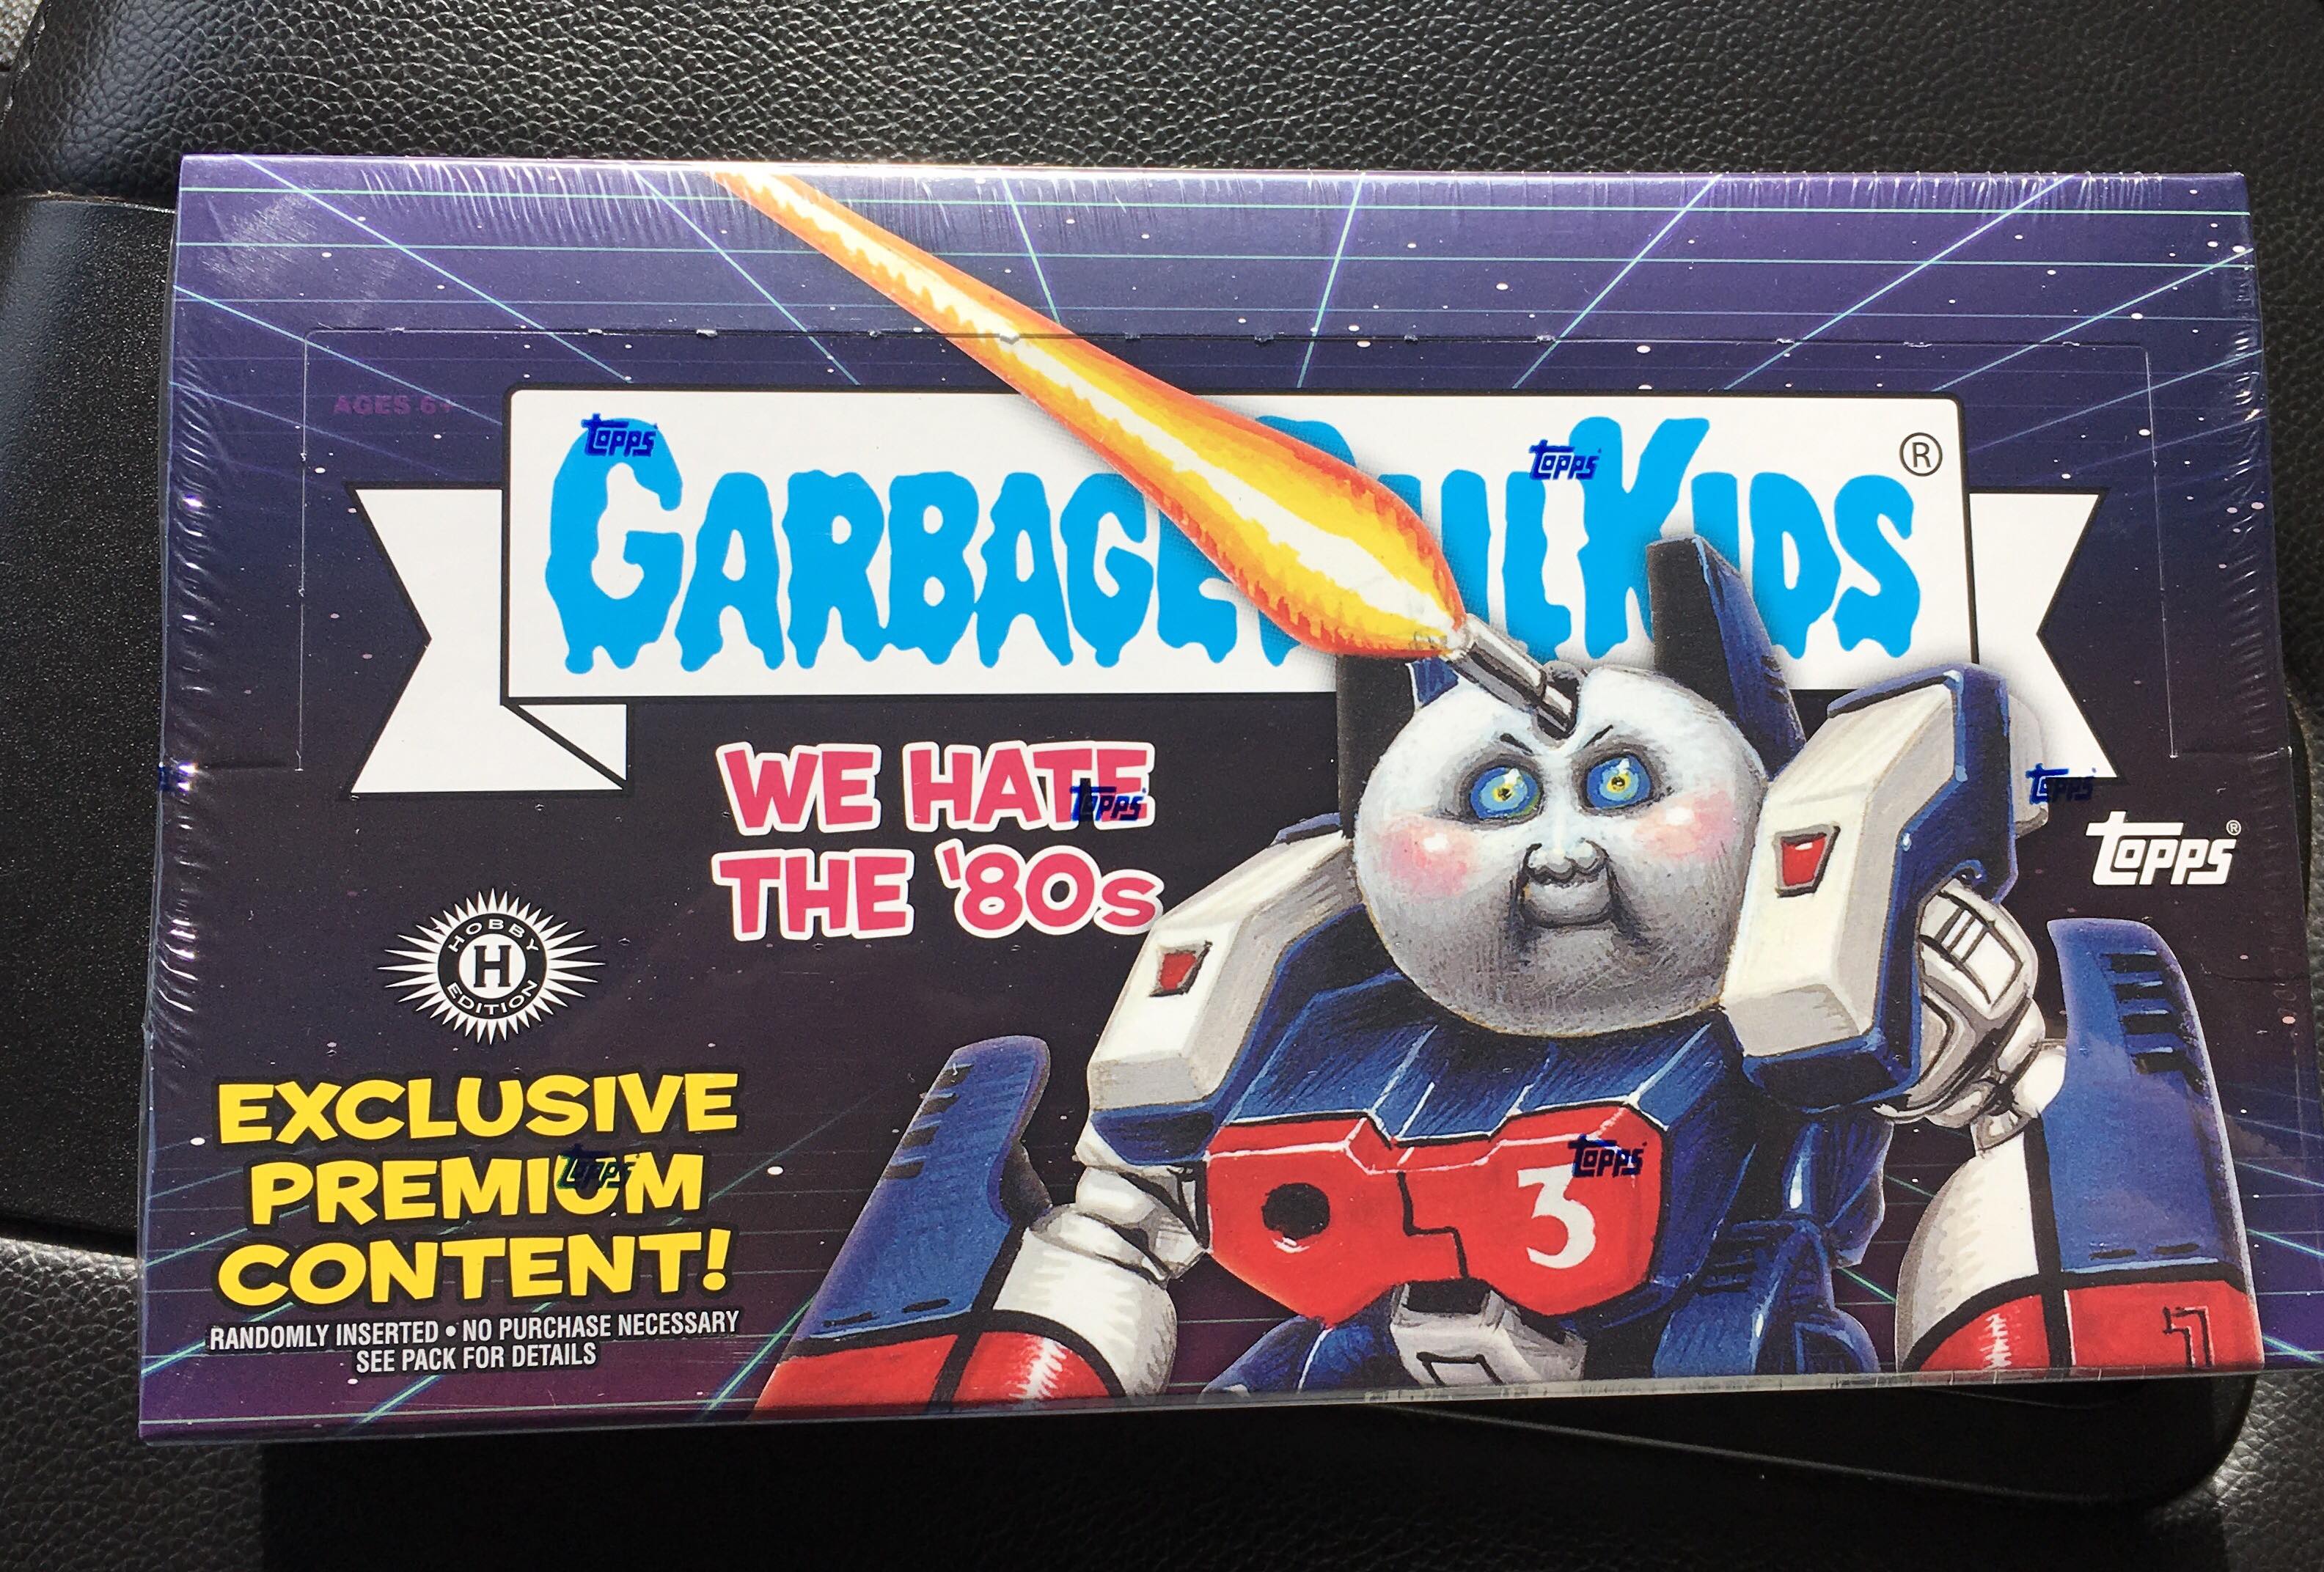 Topps had a solid 2017 when it came to retail sets. Both Adam-Geddon and Battle of the Bands were well received by collectors. Battle of the Bands was released just last October. After taking a 3 month break, Topps is back with the first set of the year, 2018 Series 1 Garbage Pail Kids We Hate the 80’s. Despite the short window of time between releases, collectors have been eagerly anticipating We Hate the 80’s. The majority of collectors grew up in the 80’s, and that’s when the GPK phenomenon took off. How does that anticipation affect production, if any? Let’s see what we can figure out. This time around however, as you will see, Topps threw us a curveball with the odds. Time to get down and dirty with numbers!
First my disclaimer! Production numbers are never an exact science, and Topps makes it tough on us. In order to attempt to solve this riddle we need to look very closely at the clues in both the odds and the sell sheets. Some things to keep in mind for this post. 1) Topps doesn’t want the public to know exactly how much of each card was made. Why? No idea really, I think its dumb, but historically Topps only provides enough information to get close. 2) We need to make some assumptions. Those assumptions will be based on the clues we have, but still some guessing has to happen. 3) The odds never quite seem to come out completely equal. However we can round and get pretty close to how much was produced. 4) Topps changes what is printed from what the sell sheet says all the time. This will throw off all our numbers. 5) Keep in mind Topps historically holds back 5% of the print run to cover missing hits, damaged cards, and their No Purchase Necessary program. These numbers would include that 5%. With all that in mind let’s get started…(Warning lots of math coming up. If you don’t want to read about the process, skip to the bottom for the answer sheet!)
 To start we need to determine how many packs were made for the entire print run. In order to do that we need a card type where all the odds are exactly the same in Collector and Retail/Hobby packs. In the past this was easy. Historically, Topps has used the same exact odds for both the Gold borders and the Artist autographs. For the most part that stays the same this set, with one exception. For the first time, Topps changed up the Jumbo Retail pack odds. Usually they are 1/2 of all the other packs, because there is double the amount of cards. So in the past we counted Jumbo packs as two packs. Now as you will see below the numbers are slightly off. The only way to possibly take a stab at this is to assume the Jumbo odds are 1/2 a regular pack. Just keep in mind the odds are slightly easier for the Jumbo Retail packs, making production numbers actually less than what I have stated in the article. Its not by a lot, but our numbers are off a bit.
One important thing Topps did fix this time around was the parallel odds, compared to Battle of the Bands. If you remember the odds printed on Battle of the Bands were overstated by double. Topps has corrected that with the new release, this should lead to less confusion.
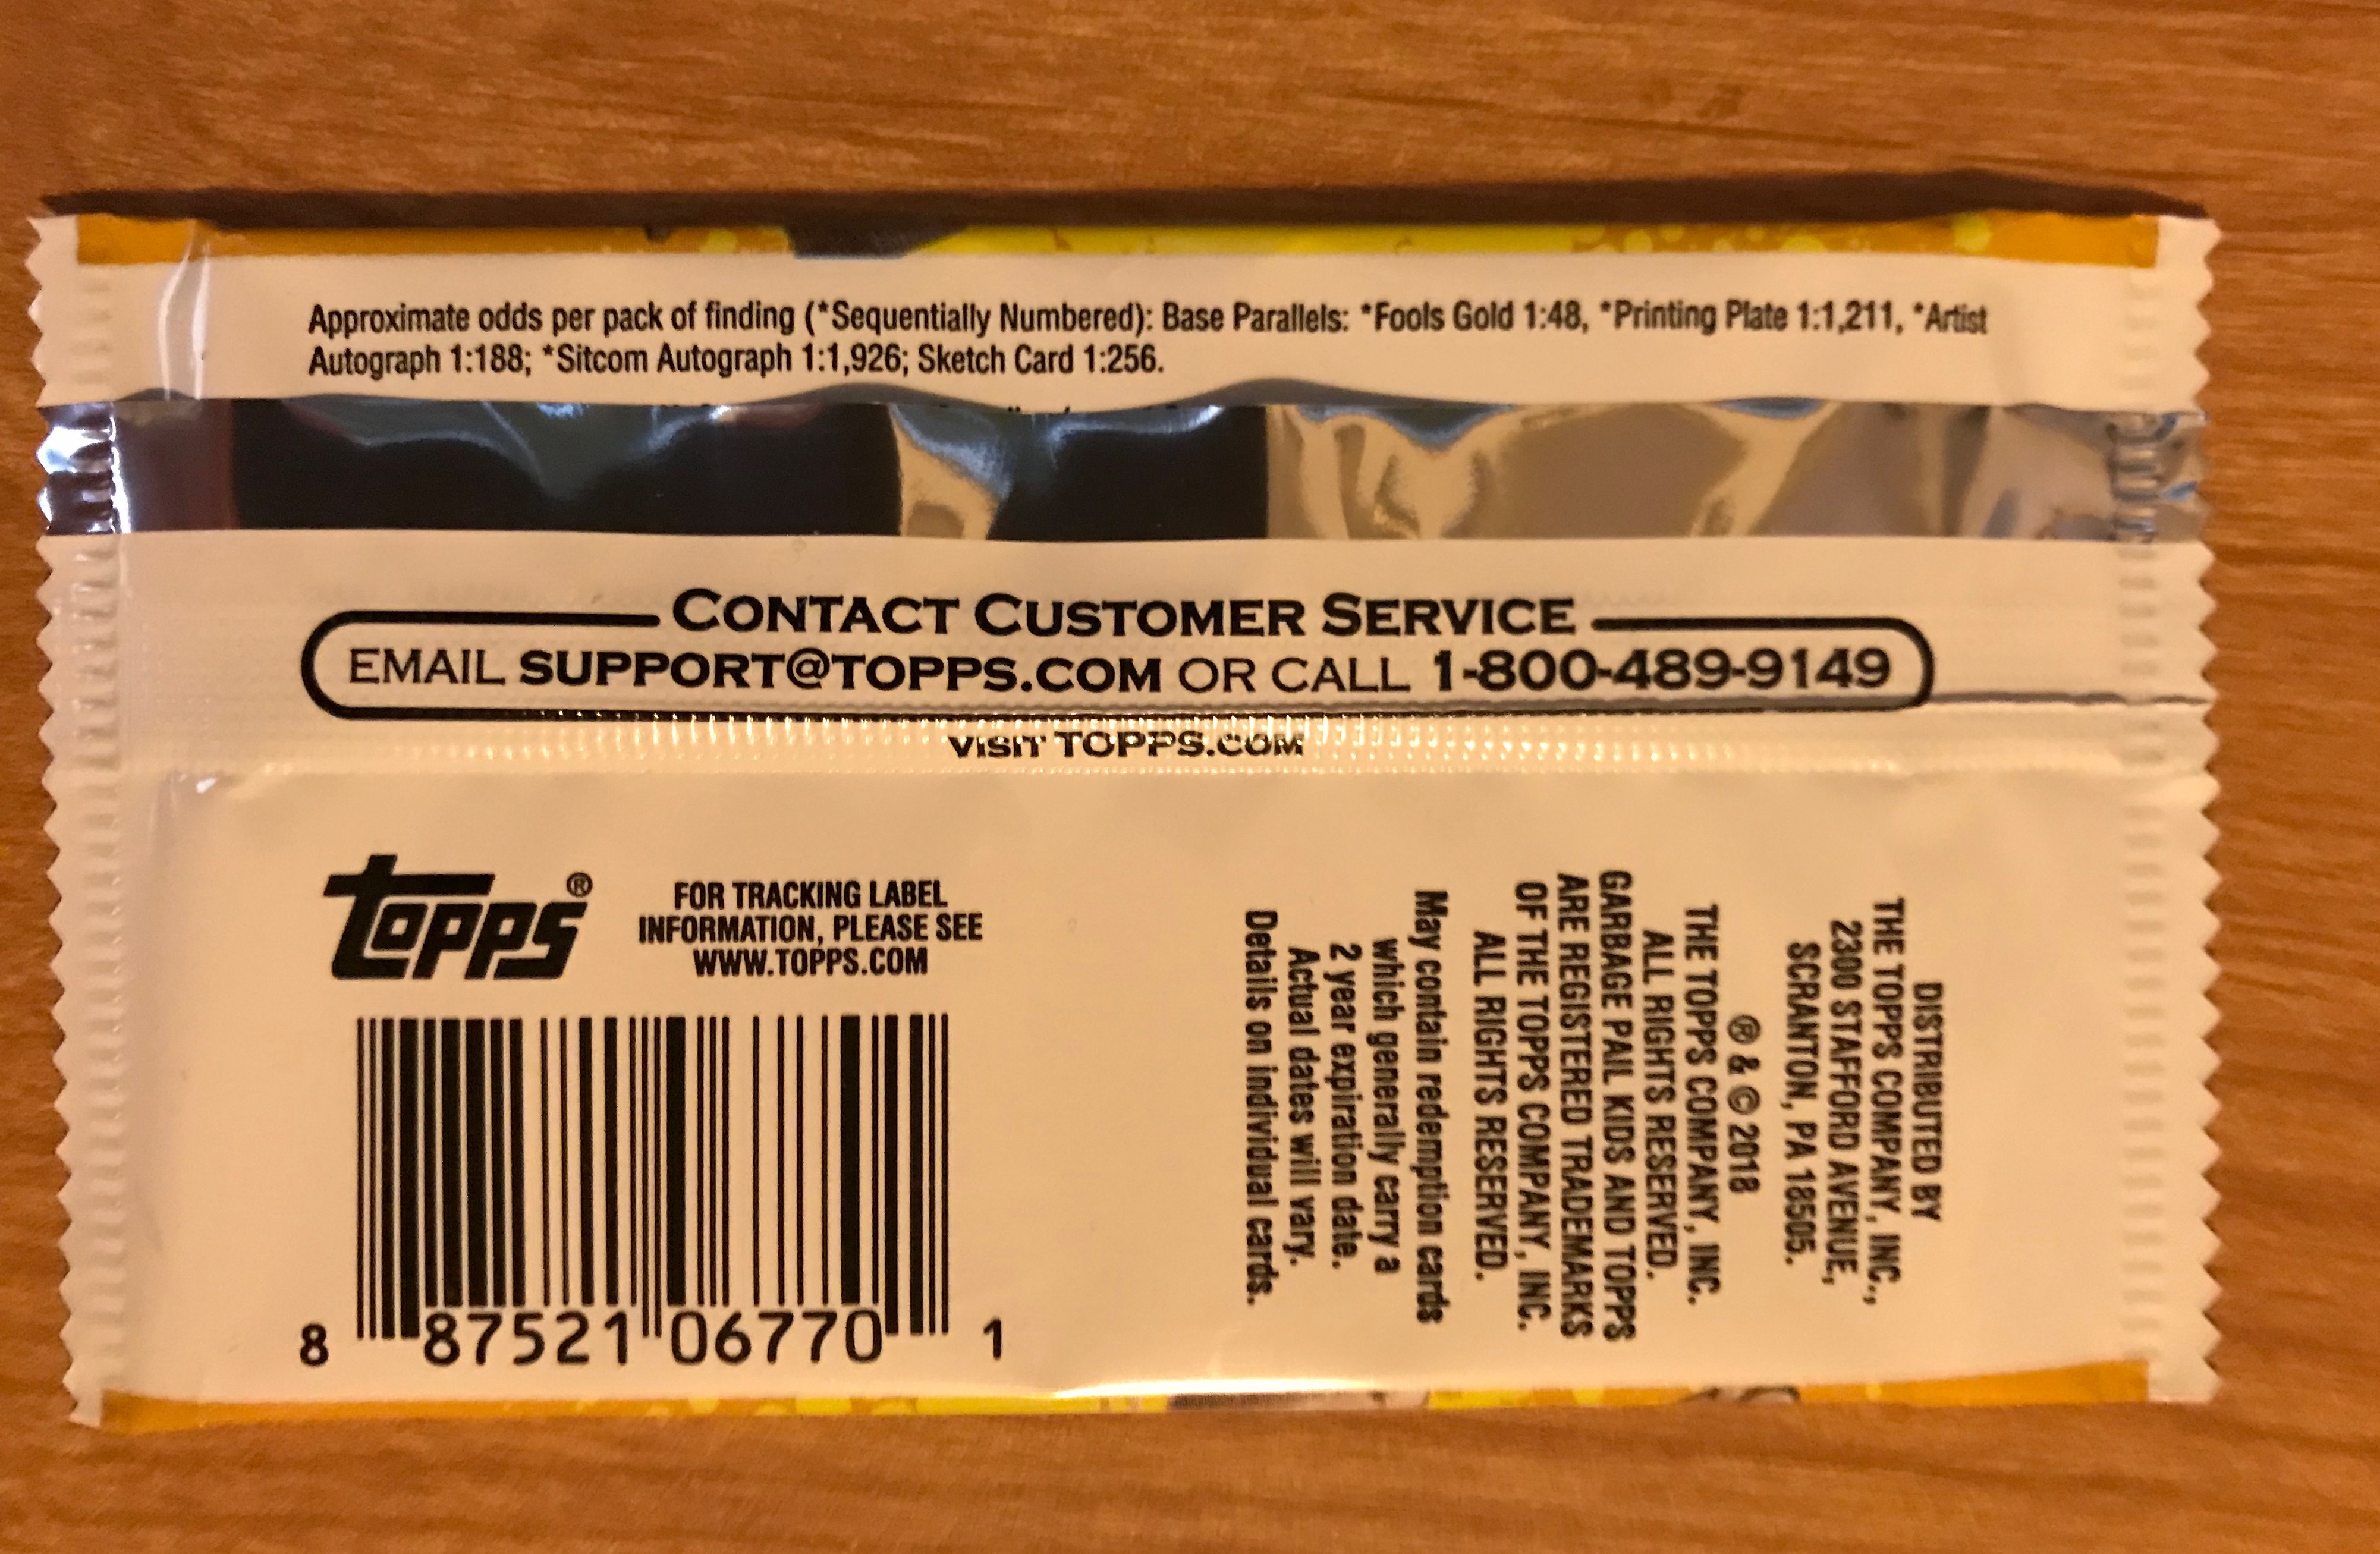
Gold borders this time are set at 1:48 packs in Collector, Retail, Blaster, and Gravity packs. The exception is Jumbo retail packs, at 1:20, if we double those we still only get 1:40, which is slightly less that it should be. If we assume the odds were printed correctly by Topps, that will throw of our numbers just slightly. In order to come up with an estimate, we will use the 1:48 number. There are 180 base cards in the set, and Gold borders are /50 on the back. Therefore, 180 X 50 number of golds per card = 9000 total Gold borders X 48 odds = 432,000 total packs made for release. While very close to the previous release, this does indicate production is down.
Can we be sure about 432,000 packs being made? We can also check total pack production using the Artist Autographs. There are 90 different autos in the set X 25 autos per card = 2,250 total autos in the print run x 188 odds = 423,000. That number is pretty close to the number we got when using the Gold odds. Why the difference? A few reasons, the odds for autos in Collector is different by one, 1:189. Also remember Jumbo Retail pack odds are easier at 1:76. Double that we only have 1:152. This I think helps explain the difference in the numbers. I am going to use the 432,000 number for total packs made. Just keep in mind the production is actually a little less due to the Jumbo Retail odds.
 Next we need to try to figure out how many of each pack type was created for the set. Collector packs are always easier to figure out because they have the cards that are exclusive to the set. We need card types that are only in Collector packs, and we know already how many were made. Once again there are three types, Patches, Bloody Red borders, and Spit Blue borders. Here’s what the math looks like on those:
- Patch Cards – 20 cards in set X 50 made per card = 1000 total patches x 39 odds = 39,000 Collector packs made
- Bloody Red borders – 180 cards in set X 75 made per card = 13,500 total Red borders X 3 odds = 40,500 Collector packs made
- Spit Blue borders – 180 cards in set X 99 made per card = 17,820 total Blue borders X 3 odds = 53,460 Collector packs made
Ok so what gives here? Why in the world are the numbers so different? You will notice that the numbers for the Patches and Red borders are pretty close, but the Blue borders are way off. Topps did something different for the first time on the Collector odds. Both the Red and Blue borders are listed with the same exact odds at 1:3. In the past, every set has had the odds listed as 1:3 for Reds and 1:2 for Blues. We also know from previous sets that those weren’t the true odds. Topps usually rounds the odds up or down to the nearest whole number. I have no idea why Topps changed the Blue odds to 1:3. In real world box busting the number of actual blues and reds pulled has remained the same. Collector boxes are averaging 8 Reds and 11 Blues per box. This is consistent with previous releases. I believe the Blue Spit odds are the one thing Topps incorrectly printed on the packs, and the actual odds are closer to 1:2. This would put the total pack numbers more in line with the other two cards types. I’m confident using 39,000 as the number for total Collector packs produced.
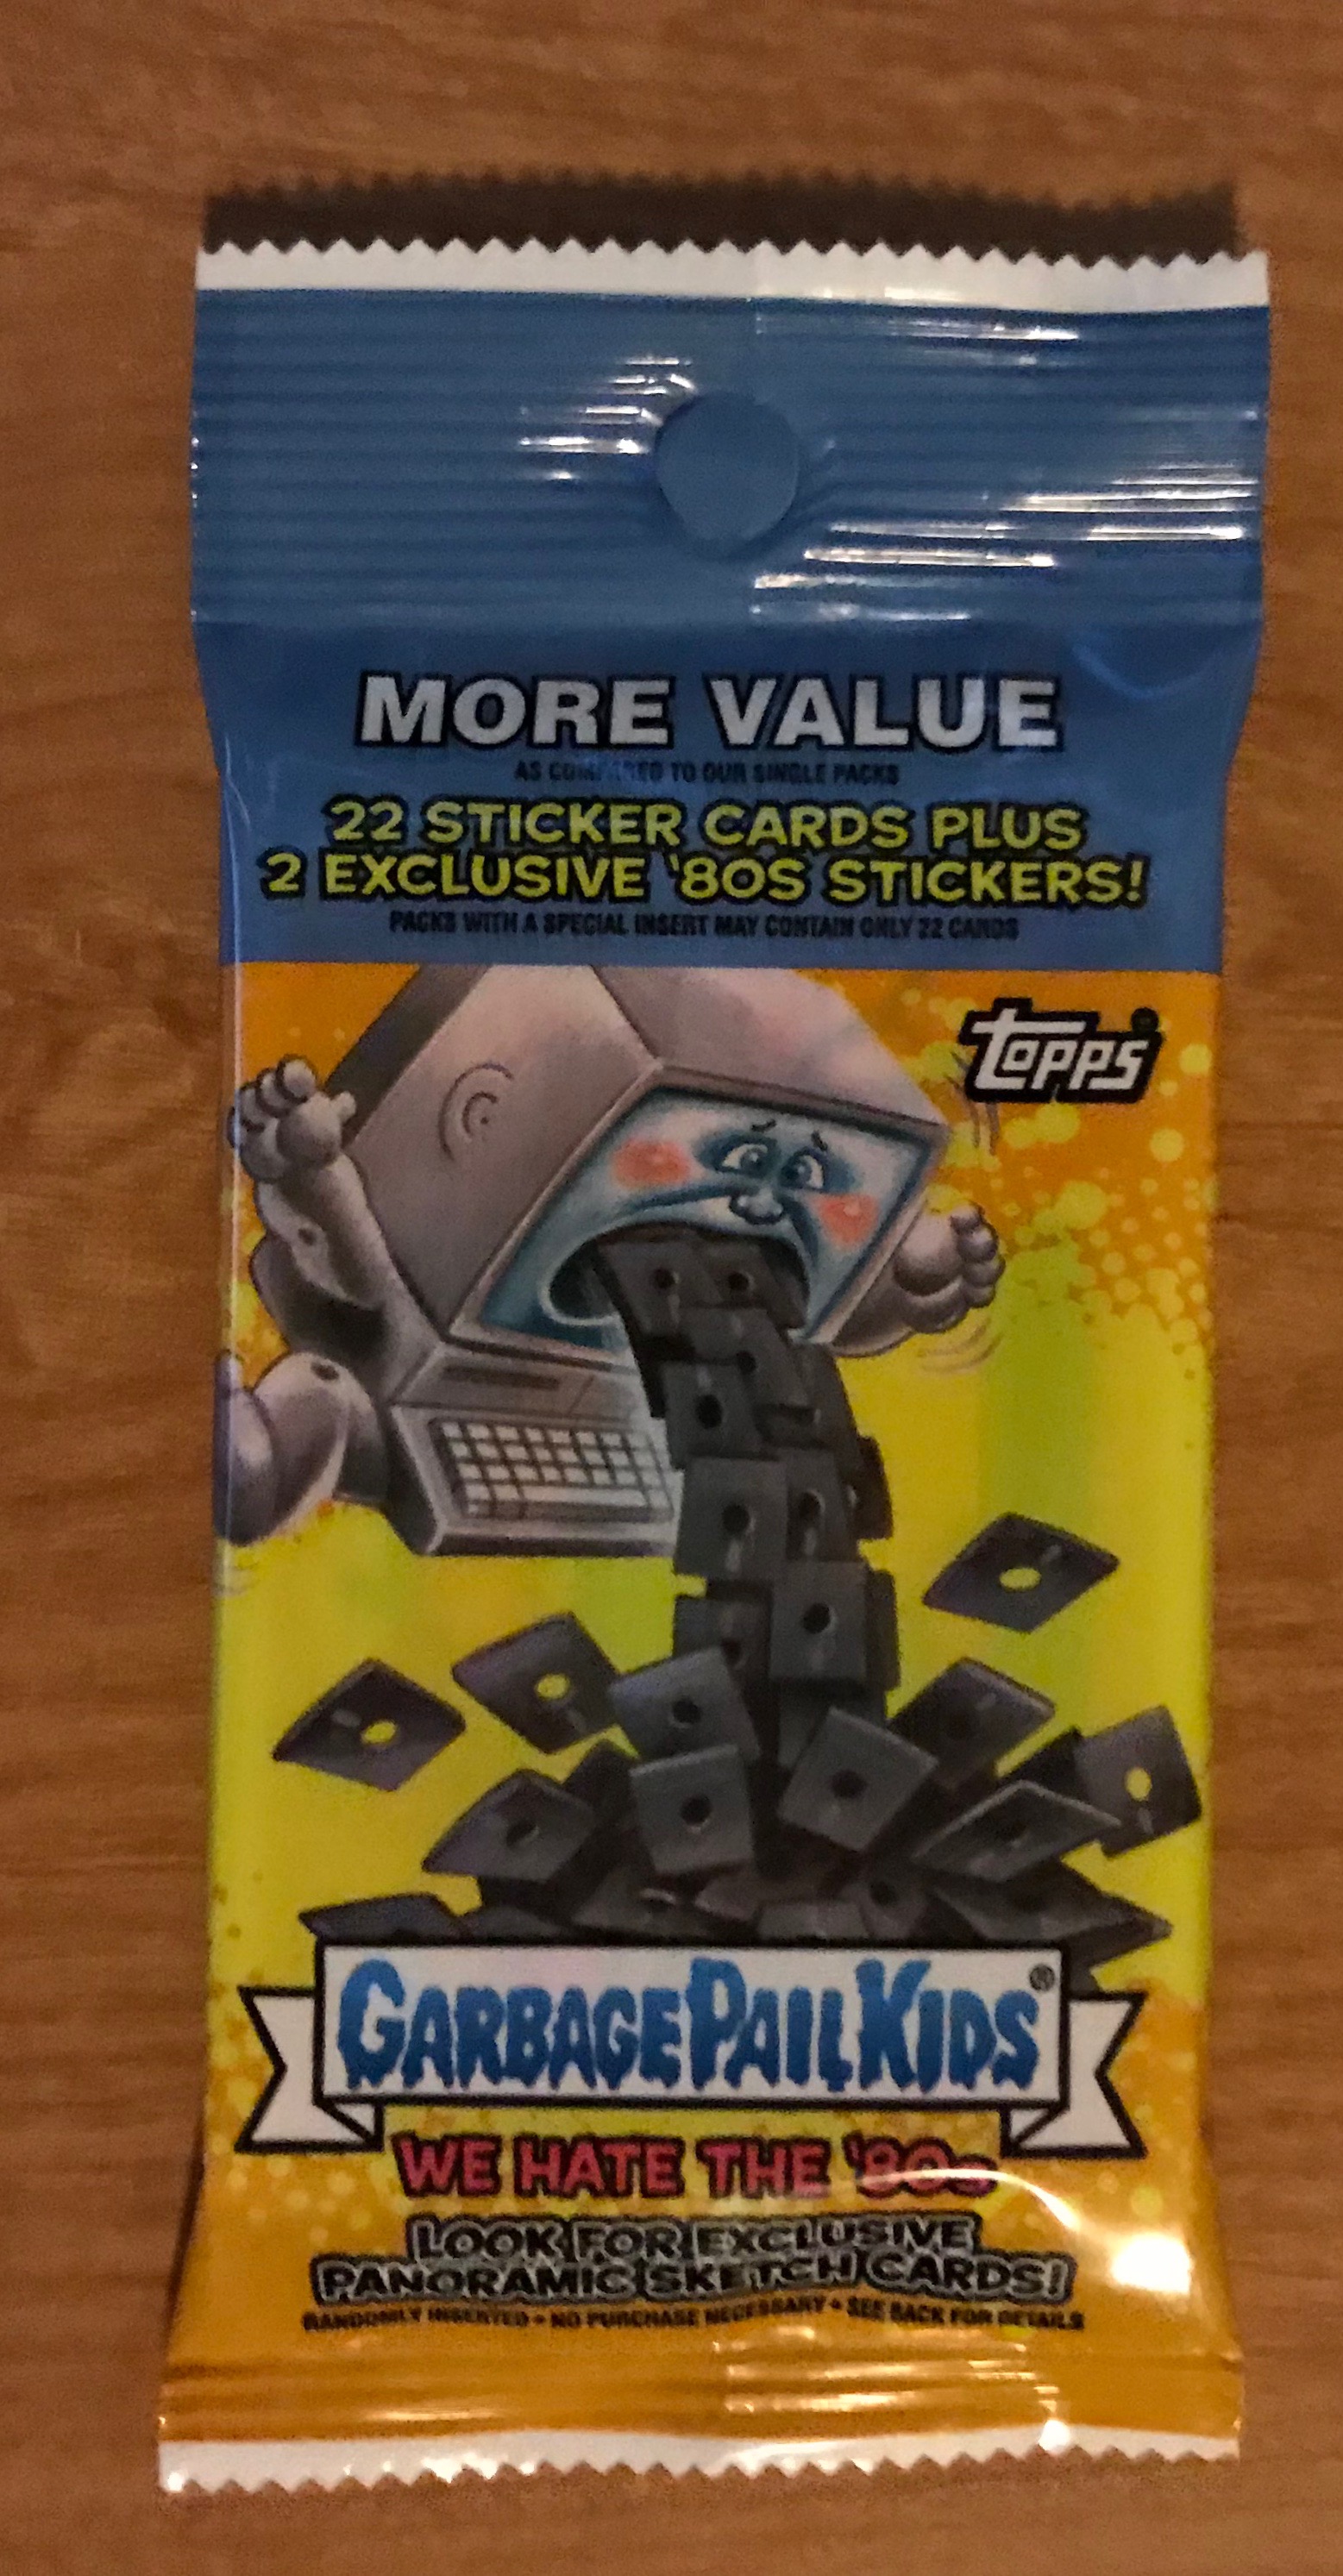
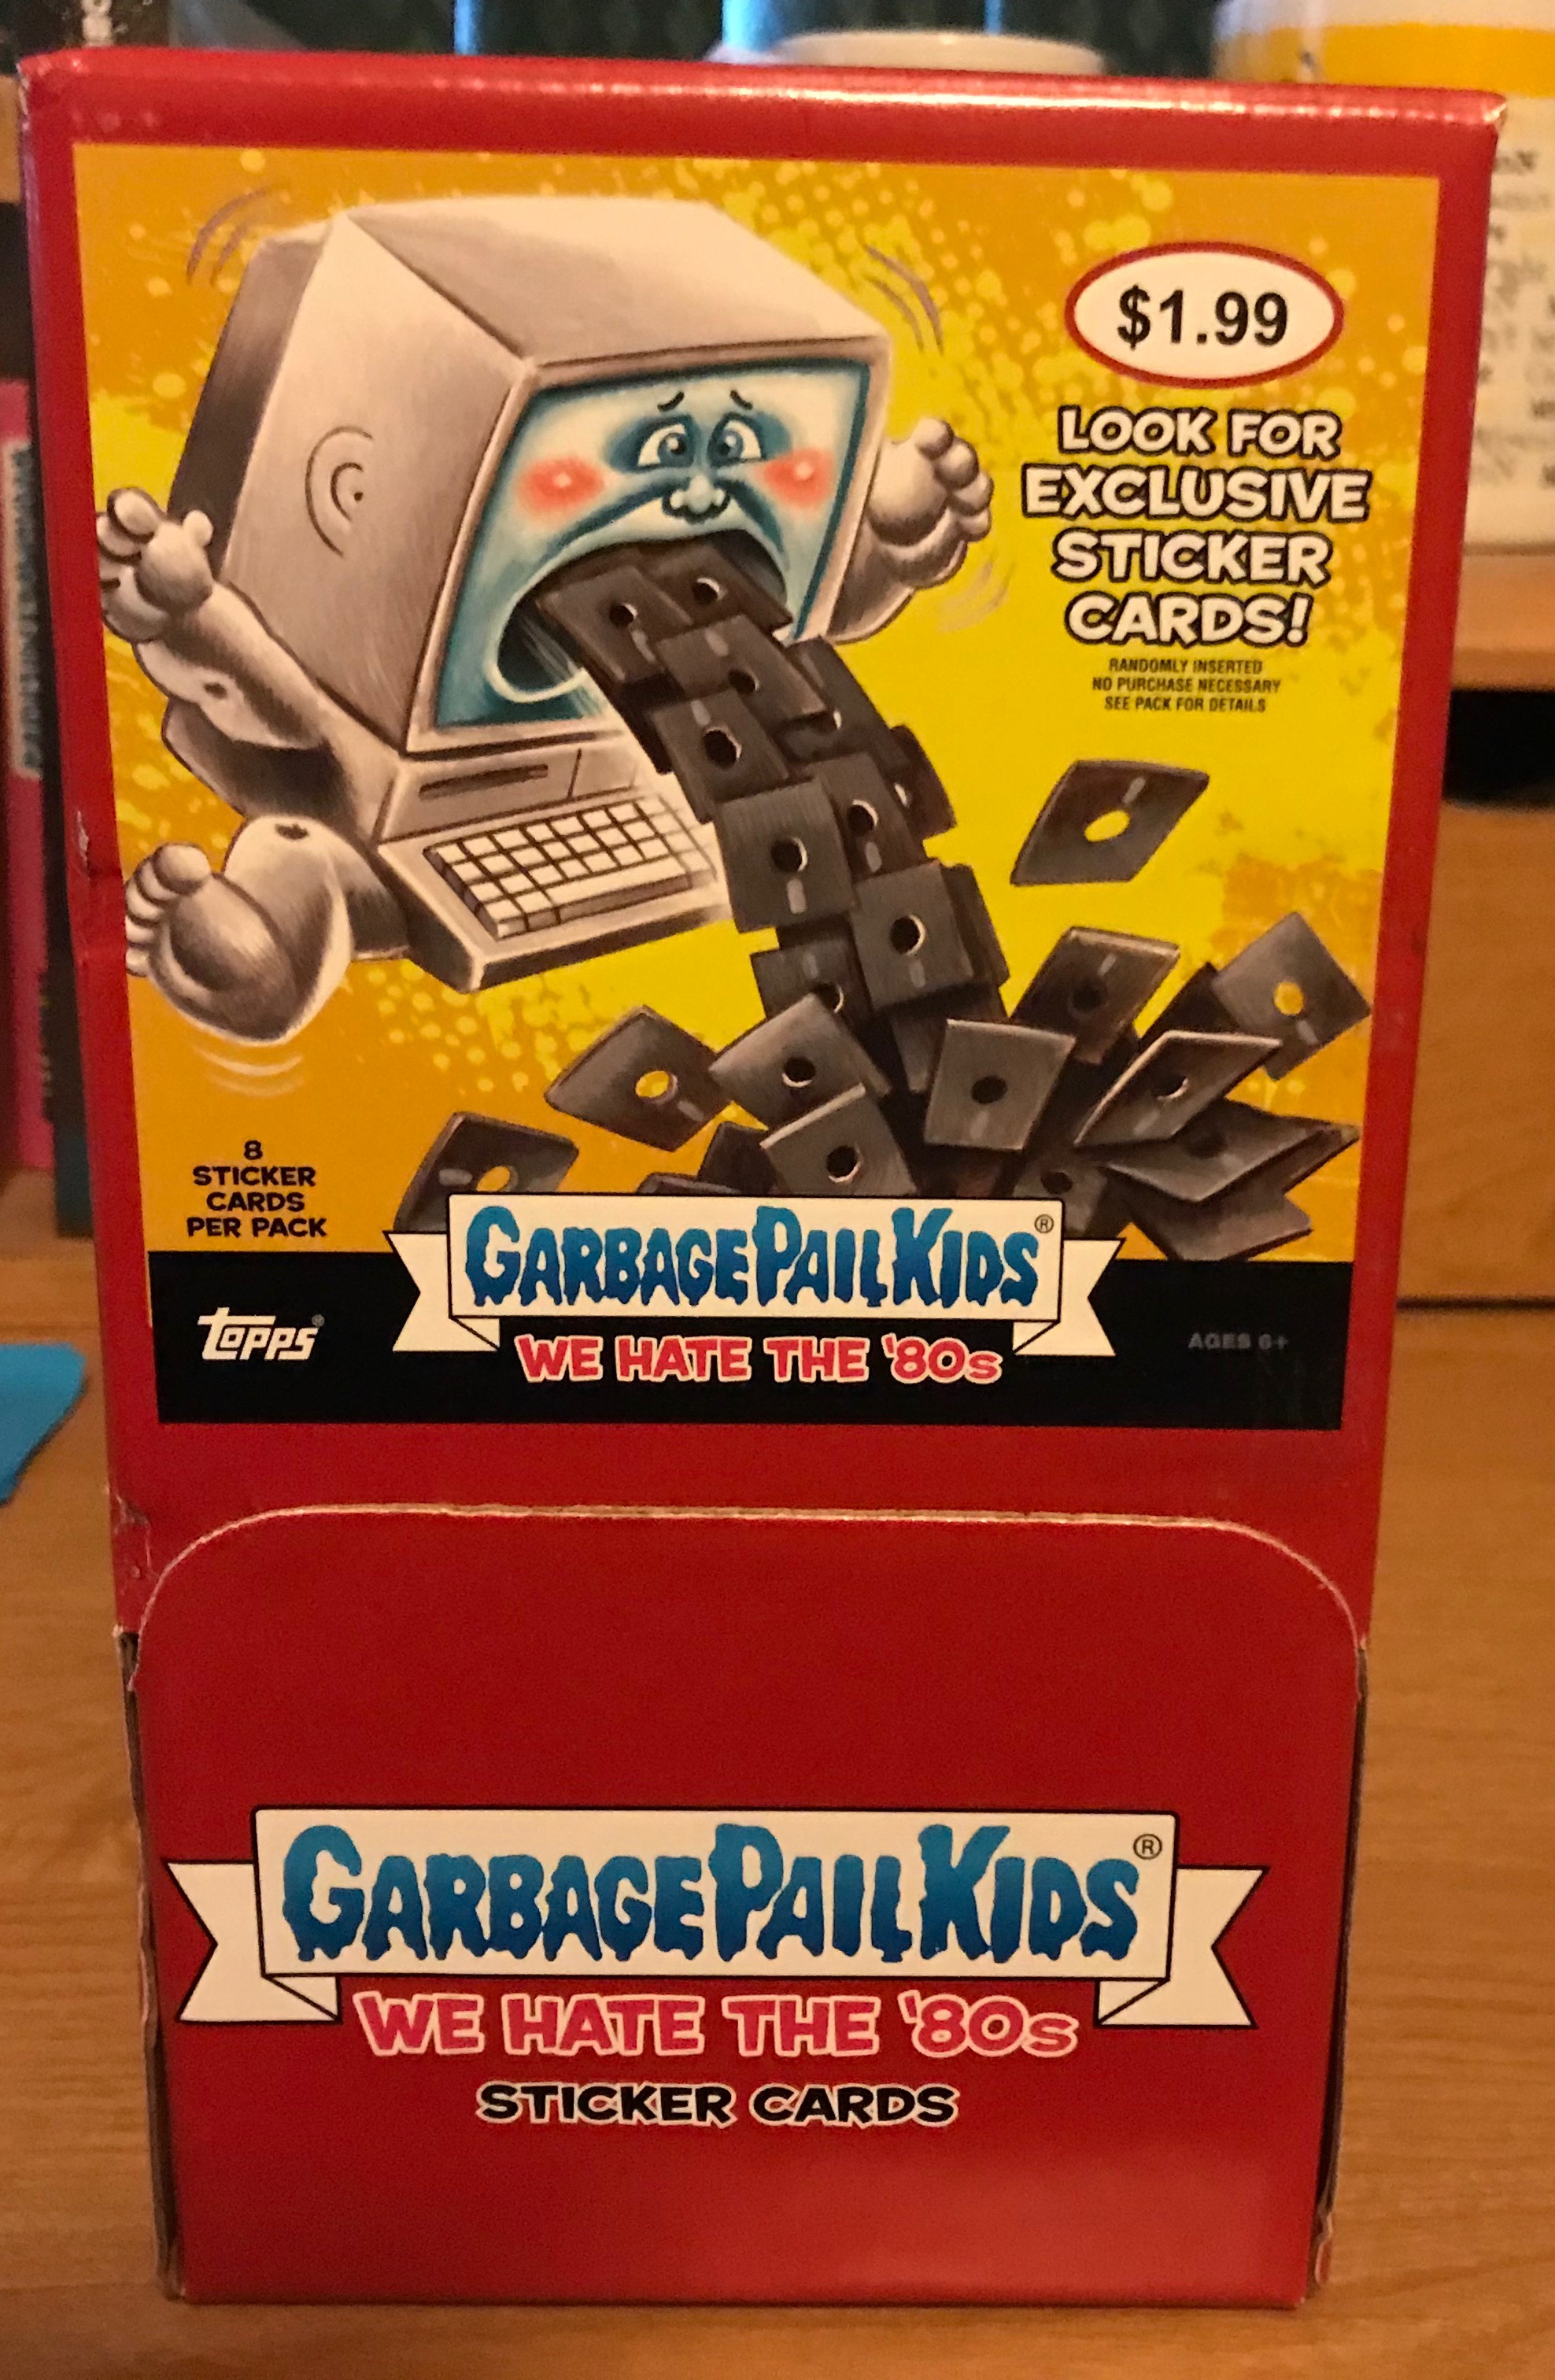 How about other pack types? Once again Hobby boxes are nonexistent, and exist in name only. Starting with Adam-Geddon Topps has made Hobby boxes the same as Regular Retail boxes. There are no longer any marks on the packs or boxes that distinguish a Hobby box vs. a Retail box. Also, the odds are exactly the same. Since all cards types are the same there is no way to tell how many Hobby/Retail boxes were produced. Sadly the same holds true for retail packs. In order to determine how many different types of retail packs were made, we would need a card type that is only in one type of retail pack, and we know how many were made. The only cards types that are individual to retail packs are Loaded Sketches and Panoramic Sketches. Topps no longer releases how many sketches are inserted into each pack type. So just like with Battle of the Bands the rest of our discussion will combine all Hobby/Retail pack types into one number. Keep in mind a Jumbo Retail packs counts as 2 packs in our numbers.
We know there are 39,000 Collector packs. How many Retail/Hobby packs to we have? 432,000 total packs – 39,000 Collector packs = 393,000 Retail/Hobby packs. That sounds like a whole lot of packs, but in reality, We Hate the 80’s is the lowest produced GPK set in the last three years, barely beating out the previous set, Battle of the Bands.
Here’s what I believe the total production numbers to be for We Hate the 80’s:
- Total Production – 432,000 Packs
- Collector – 39,000 Collector Packs or about 1625 Hobby Boxes or about 203 Collector Cases
- Retail/Hobby – 393,000 Retail/Hobby Packs
(Once again our numbers are slightly off due to the easier Jumbo Retail odds. So in reality there is even less production of We Hate the 80’s than stated. However, I’m confident these numbers are really close.)
So what does this all mean? Once again the trend of production numbers being down continues. I’m a little surprised as Battle of the Bands was well like by collectors. Maybe the quick turnaround between sets affected how many cases were ordered by distributors. In looking at the numbers, while Collector box production is down compared to the last set its still the second highest by Collector box. Take a look at the last five sets and the production numbers:
- Total Pack Production
- Apple Pie – 484,000
- Trashy TV – 638,000
- Adam-Geddon – 459,000
- Battle of the Bands – 441,000
- We Hate the 80’s – 439,000 (<.1% decrease in total overall production vs. Battle of the Bands)
- Collector Pack Production
- Apple Pie – 36,500
- Trashy TV – 35,000
- Adam-Geddon – 36,000
- Battle of the Bands – 41,000
- We Hate the 80’s – 39,000 (5% decrease vs. Battle of the Bands)
- Retail Pack Production
- Apple Pie – 408,500
- Trashy TV – 550,000
- Adam-Geddon (Includes Hobby packs) – 423,000
- Battle of the Bands (Includes Hobby packs) – 400,000
- We Hate the 80’s (Includes Hobby packs) – 393,000 (2% decrease vs. Battle of the Bands)
Topps prints to order their product. Which means based on distributor pre-orders, Topps decides how much product to produce. The numbers show for the most part this set was printed in very similar quantities as both Adam-Geddon and Battle of the Bands. Collectors continue to gravitate to purchasing Collector boxes. More than likely collectors have stop purchasing “Hobby” boxes, since they have figured out now they are the same as Retail. With production numbers trending downwards just slightly, it will be interesting to see if Topps changes anything up in the formula for the new retail series.
Always interesting stuff to consider. Let me know your thoughts on the numbers in the comments!
This is Part 1 of a two part series on the production of 2018S1 Garbage Pail Kids We Hate the 80’s. In Part 2 we will look at production numbers for all parallel and insert sets. Part 2 will be posted soon.