
This is Part 1 of a 2 part series on the production of 2022 Series 1 Garbage Pail Kids Book Worms. Part 2 will be posting soon.
 Collectors have had to wait a long 17 months for a new retail GPK set from Topps. With that long of a wait and reported sticker stock shortages, collectors wondered just how much Topps would print of 2022 Series 1 Garbage Pail Kids Book Worms. Any thoughts of a limited print run were thrown out quickly after odds started coming out. After running the numbers its clear this is the largest printed GPK set since at least 2010, and it’s not even close. So just how much of this set was produced? Read on to find out!
First my disclaimer! Production numbers are never an exact science, and Topps makes it tough on us. In order to attempt to solve this riddle we need to look very closely at the clues in both the odds and the sell sheets. Some things to keep in mind for this post. 1) Topps doesn’t want the public to know exactly how much of each card was made. Why? No idea really, I think its dumb, but historically Topps only provides enough information to get close. 2) We need to make some assumptions. Those assumptions will be based on the clues we have, but still some guessing has to happen. 3) The odds never quite seem to come out completely equal. However, we can round and get pretty close to how much was produced. 4) Topps changes what is printed from what the sell sheet says all the time. This will throw off all our numbers. 5) Keep in mind Topps historically holds back up to 5% of the print run to cover missing hits, damaged cards, and their No Purchase Necessary program. These numbers would include that 5%. With all that in mind let’s get started…(Warning lots of math coming up. If you don’t want to read about the process, skip to the bottom for the answer sheet!)
 To begin we need to figure out how many packs were made for the entire print run. We need to use a card type that has the same odds across all various pack types, and where we know the number made. This time there are two types of cards that fit this description, Moby Dick Gray and Fool’s Gold parallels. First, a couple of notes. As a Topps tradition, they have once again overstated the parallels by double. While Topps left off the 1 per pack parallels like Green and Black from the odds, the other parallels are falling at twice the rate they should based on actual case breaks. This isn’t surprising as just about every retail set has been this way since 2015. Come on Topps, change your methods! The one good thing with this release is because Topps eliminated Fat Packs and cancelled Blasters, with only three box types, it’s very easy to determine most numbers. We have more insight to this set than any other in recent memory.
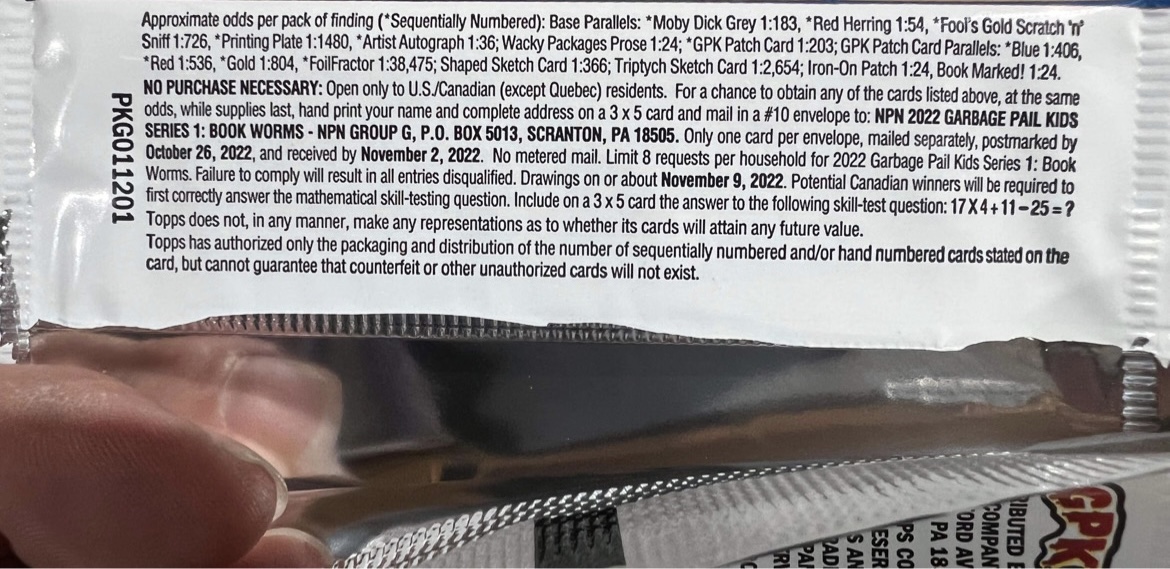
Gold parallels are listed at 1:726/727 in Collector, Retail, and Mega packs. Since the odds are overstated by double, I’ll be using 1:363.5 as the actual gold odds. There are 200 base cards in the set. This release the Golds are /50 on the back. Therefore, 200 * 50 number of golds per card = 10,000 total gold parallels * 363.4 odds = 3,635,000 total packs made for this release! Holy crap, that can’t be right, is it!?! Ok let’s look at the Gray parallels. Printed odds are 1:183 in Collector, Retail, and Mega packs. Since odds are overstated by double, I will use 1:91.5 as the odds. So, 200 * 199 number of Grays per card = 39,800 total Gray parallels * 91.5 odds = 3,641,700 total packs made for this release! Sticker stock shortages my a$$!!! The print run for this set is double that of Food Fight, which was already the highest set since we’ve had pack odds. It’s clear GPK is riding the same wave with the rest of the trading card industry, with demand skyrocketing over the last couple of years.
Now that we know total pack production, let’s try to break it down by pack type. Collector and Retail Display packs are easy to figure out because they have a couple of different numbered parallels or inserts exclusive to the pack. Let’s look at red parallels and patches for Collector first.
- Patch Cards – 10 cards in set * 199 made per card = 1,990 total patches * 203 odds = 403,970 Collector packs made
- Red Herring borders – 200 cards in set * 75 made per card = 15,000 total Red borders * 27 odds = 405,000 Collector packs made
Both of these numbers are very close, and gives us a great idea how many Collector packs were made. I’m going to use 405,000 as the pack number for Collector packs. Now let’s look at the Blue parallels for the Retail Display packs.
- Sleep Drool Blue borders – 200 cards in set * 99 made per card = 19,800 total Blue borders * 28.5 odds = 564,300 Retail Display packs made
 To make things easy I’ll use 564,000 as the Retail Display pack number. Looking at both the Collector and Retail Display pack numbers compared to the previous release, 2021S1 Food Fight, we can start seeing where the significant increases are. Collector packs are nearly double form Food Fight. Retail Display backs aren’t quite double, but show huge gains. So if Topps eliminated Fat Packs and cancelled Blasters, where are all the other packs? All at Walmart in their exclusive Mega boxes. We know there are 3,635,000 total packs – 405,000 Collector packs – 564,000 Retail Display packs = 2,681,000 total Mega packs! That puts total retail pack production at double of Food Fight. These numbers are really big!
Here’s what I believe the total production numbers to be for Book Worms:
- Total Production – 3,635,000 Packs
- Collector – 405,000 Collector Packs or about 16,875 Collector Boxes or about 2,109 Collector Cases
- Retail Display – 564,000 Retail Display Packs or about 23,500 RD Boxes or about 2,937 RD Cases
- Mega Box – 2,681,000 Mega Box packs or 157,705 Mega boxes
Production is up significantly over Food Fight. This is the fourth straight GPK release to set record release numbers. We aren’t in OS territory yet, but it’s been years since GPK has seen production like this. Take a look at how production compares to recent sets.
- Total Pack Production
- Late to School – 670,000
- 35th Anniversary – 1,113,000
- Food Fight – 1,790,000
- Book Worms – 3,635,000 (103.1% increase in production vs. Food Fight)
- Collector Pack Production
- Late to School – 74,000
- 35th Anniversary – 130,000
- Food Fight – 225,000
- Book Worms – 405,000 (80% increase in production vs. Food Fight)
- Retail Pack Production
- Late to School – 596,000
- 35th Anniversary – 983,000
- Food Fight – 1,565,000
- Book Worms – 3,245,000 (107.3% increase in production vs. Food Fight)
After figuring out numbers on sets for 7 years now, i have never seen an over 100% increase, or double in production. I continue to be amazed by the production numbers over the last 3 years. The popularity of trading cards, including GPK, has exploded and it remains to be seen how long the increases will continue. The odds are so long on hits now, it’s takes 2 Collector cases to just hit 1 sketch card. Printing plates, that were fairly abundant in Collector cases, are now 1:7 cases. Topps has now had to increase auto print run to 160, and add patch card parallels just to get enough hits for Collector boxes. Perhaps most interesting is how this will play out the remainder of 2022 and into 2023. Does the Chrome OS 4 print run surpass Boom Worms? Will Topps find enough sticker stock to print 2021S2 Vacation, and how much gets printed? The coming months will be fascinating to see how Topps navigates the GPK landscape.
This is Part 1 of a 2 part series on the production of 2022 Series 1 Garbage Pail Kids Book Worms. In Part 2 we will look at production numbers for all parallel and insert sets. Part 2 will be posted soon.