
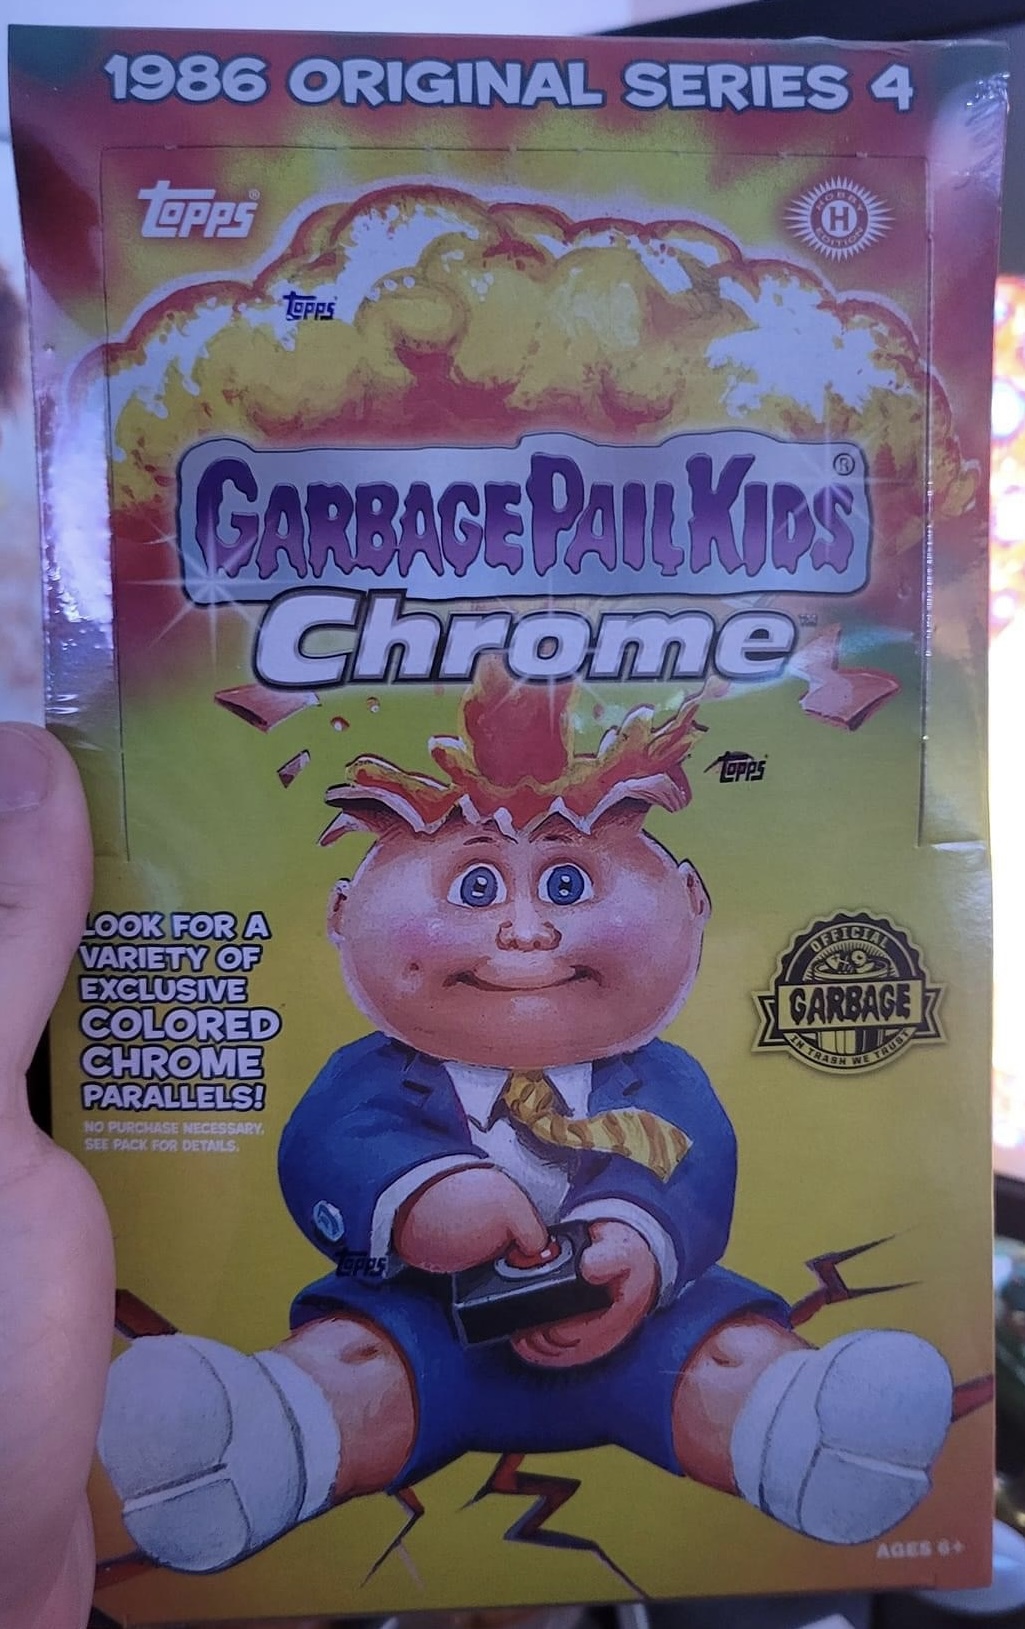
 After the very successful return of Chrome to the GPK brand with 2020 Chrome OS 3, it was a no brainer that Topps would continue the line. Covid had other ideas. Printer and paper stock shortages caused the set to be delayed, and collectors had a 20 month gap between chrome sets. That hasn’t deterred Topps from increasing the print run for Chrome 4 dramatically. As you will soon see, production is huge for this release. The only silver lining? Chrome 4 is less than Boom Worms, ending the consecutive streak of set over set increases. Let’s take a look and see just how much 2021 Garbage Pail Kids Chrome OS 4 is out there.
First my disclaimer! Production numbers are never an exact science, and Topps makes it tough on us. In order to attempt to solve this riddle we need to look very closely at the clues in both the odds and the sell sheets. Some things to keep in mind for this post. 1) Topps doesn’t want the public to know exactly how much of each card was made. Why? No idea really, I think its dumb, but historically Topps only provides enough information to get close. 2) We need to make some assumptions. Those assumptions will be based on the clues we have, but still some guessing has to happen. 3) The odds never quite seem to come out completely equal. However, we can round and get pretty close to how much was produced. 4) Topps changes what is printed from what the sell sheet says all the time. This will throw off all our numbers. 5) Keep in mind Topps historically holds back up to 5% of the print run to cover missing hits, damaged cards, and their No Purchase Necessary program. These numbers would include that 5%. With all that in mind let’s get started…(Warning lots of math coming up. If you don’t want to read about the process, skip to the bottom for the answer sheet!)
Chrome is a unique product that is dominated by numbered parallels. Because of that, Topps has done most of the work for us. Therefore, we can get all the production info done in one article. Not only that, but Topps has made it super simple to figure out production numbers. After eliminating Fat Packs from the Chrome line, it leaves us with just two box types. Each box type has exclusive numbered parallels, so we can easily determine total print run and the print run of each box type.
There are three exclusive numbered parallels inserted into Hobby boxes. Let’s start by taking a look at those.
- Orange borders – 100 cards in set * 75 made per card = 7,500 total Orange borders * 131 odds = 982,500 total Hobby packs
- Black Wave – 100 cards in set * 99 made per card = 9900 total BW borders * 100 odds = 990.000 total Hobby packs
- Red borders – 100 cards in set * 5 made per card = 500 total Red borders * 1,951 odds = 975,500 total Hobby packs
 Well all those numbers are pretty darn close to each other. Let’s go with the one in the middle, and use 982,500 as the total Hobby pack production. Woah! Almost one million hobby packs!!! Wow! Topps has dramatically increased the hobby production in Chrome 4. Now let’s take a look at Retail Blaster production. We can look at the two different numbered parallels inserted into Blaster packs.
- Black borders – 100 cards in set * 99 made per card = 9900 total Black borders * 84 odds = 832,500 total Blaster packs
- Gold borders – 100 cards in set * 50 made per card = 5,000 total Gold borders * 166 odds = 830,000 total Blaster packs
Once again those numbers are really close. Let’s use the round number of 830,000 as the total Blaster pack production. Once again, we see that production is increased for Retail packs over Chrome 3, although not quite as big of an increase compared to Hobby packs.
Well that was easy! Thanks Topps, this may be the easiest they’ve ever made it to figure out production numbers. Let’s take a look at how production compares to previous Chrome releases.
- Total Production
- Chrome OS 1 – 1,096,370
- Chrome OS 2 – 513,260
- Chrome OS 3 – 1,310,000
- Chrome OS 4 – 1,812,500
- Hobby Pack Production
- Chrome OS 1 – 407,000
- Chrome OS 2 – 71,500
- Chrome OS 3 – 560,000
- Chrome OS 4 – 982,500 (40,937 boxes/3,411 cases)
- Retail Pack Production
- Chrome OS 1 – 689,370
- Chrome OS 2 – 441,760
- Chrome OS 3 – 750,000
- Chrome OS 4 – 830,000 (138,333 boxes/3,358 cases)
The thing that stands out first is the huge increase in the Hobby pack production numbers. Over 400k more hobby packs than Chrome 3. Over double the hobby packs of Chrome 1. Retail is certainly up as well, but not by as much as Hobby. Since I’ve been looking at production numbers, Chrome 4 is the first time that Hobby production is higher than Retail production. The demand from distributors, hobby stores, and online retailers was off the charts for this release.
 Next, let’s take a look at the production for the few unnumbered card types in the set. Refractors, Atomic Refractors, and C Name cards are all unnumbered. With Chrome 3, I had to do some math gymnastics to come to a reasonable number for these card types. Topps however made it easy for us this time.
- C Name Variation – 1,812,500 total packs / 100 odds = 18,125 total C cards / 48 cards in set = 377 each C Name Variation.
- Refractors – 1,812,500 total packs / 3 odds = 604,166 Total Refractors / 100 cards in set = 6,041 each regular Refractor
- Atomic Refractors – 830,000 total Blaster packs / 2 odds = 415,000 total Atomics / 100 cards in set = 4,150 each Atomic Refractor.
The production of the unnumbered parallels above certainly match the increased pack numbers we saw earlier. More Atomics, Refractors, and C Names than any other Chrome set to date.
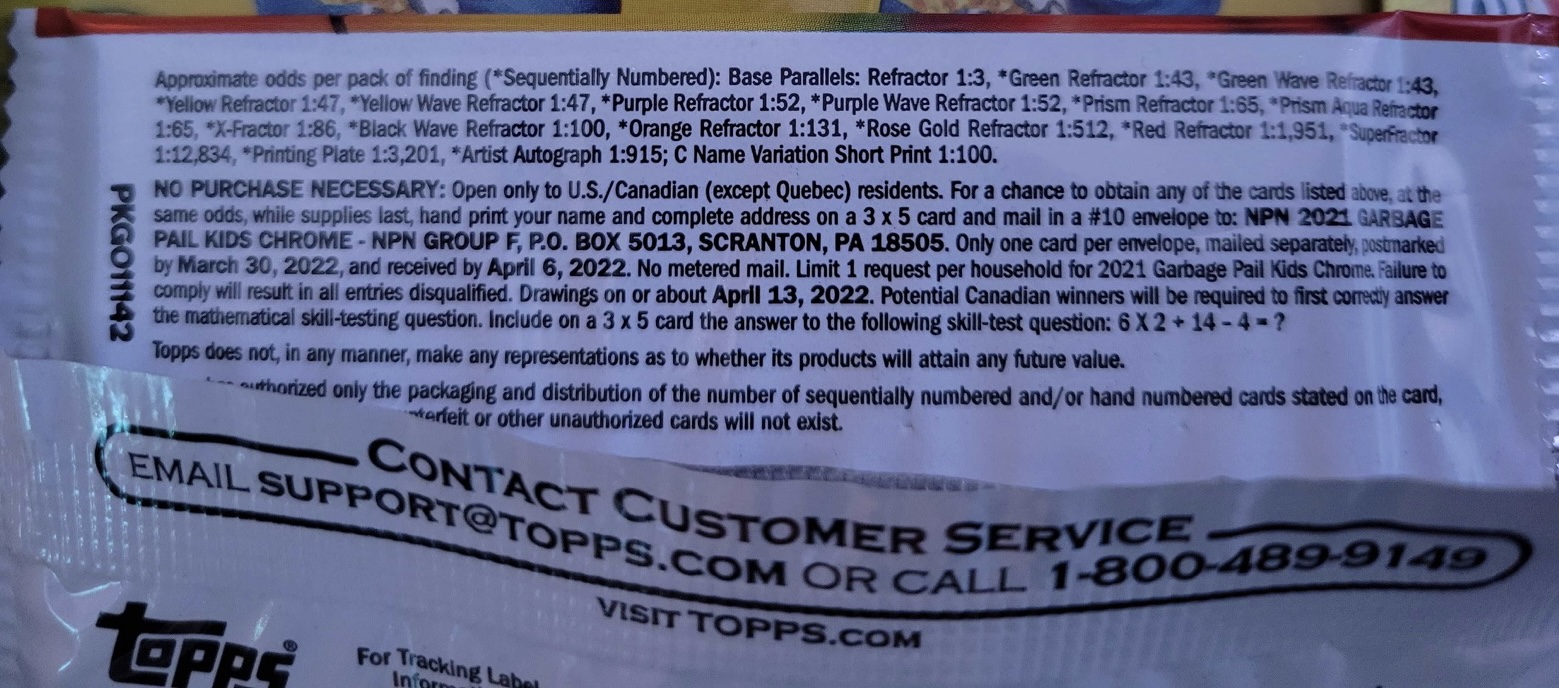
With Chrome 4 Topps couldn’t make things completely perfect for us. Everything has been so easy to figure out so far because Topps gave us all the info we need. However, what happens if Topps supplies the incorrect odds on the pack? Topps did just that with Printing Plates and Autos on Chrome 4 packs. Blaster packs show both Plate and Auto odds to be 1:915, and Hobby packs have the Auto odds as 1:915. Someone at Topps loves the number 915, but it isn’t correct. How do we know? By using the pack production numbers and the odds applied it’s impossible for the odds to be correct. For example using the auto odds supplied it comes out to just under 2000 autos in the set. That’s a neat trick considering there are only (23 auto cards * /50 each) 1,150 autos in the product. Using the Plate odds results in a similar problem. So can we figure out what the odds really are for Printing Plates and Autos? I think we can, buts it’s going to take some assumptions and a leap of faith on our part. Let’s work on Printing Plates first. Topps actually showed the Plate odds on Hobby packs as 1:3,202. I believe those odds are correct. Not only because it’s not the number 915, but because the math works out.
- Plates Hobby – 982,500 / 3,201 Hobby plate odds = 306 Printing Plates in Hobby.
- Plates Blaster – 830,000 / 96 plates in blasters = 1:8,645 Blaster Printing Plate Odds
We know there are 400 plates inserted in the set. If we assume the Hobby plate odds are correct, that’s gives us 306 in Hobby, leaving just 94 plates in Blaster packs. Why do I believe this is correct? Thanks to the excellent work of GPK collector Jason Tipps. He calculated that there is just over 23% of each parallel type inserted in Blasters. The numbers are consistent for every numbered parallel that’s in both Blasters and Hobby packs. As luck would have it 94 plates in Blasters is 24% of 400! That right there is consistent with the numbers Tipps calculated. Therefore, I’m fairly confident in saying the Plate odds on hobby packs is correct and the Blaster Plate odds should be right around 1:8,645. How about Artist Autos? What if we use the same 23% theory on the Autos? 23% of the autos inserted would be 264 autos in Blasters, leaving 886 in Hobby packs. The odds would look like this.
- Blaster autos – 830,000 packs / 264 autos in blasters = 1:3,143 Blaster Auto Odds
- Hobby autos – 982,500 packs / 886 autos in Hobby = 1:1,108 Hobby Auto Odds
Ok, so with autos we are taking a few liberties and assumptions that I’m not comfortable in saying these are the accurate Auto odds. But given the 23% theory, this is a great guess at what the actual auto odds look like in the set.
It’s clear the demand for GPKs has increased quite dramatically over the last two years. With every set release we see production numbers keep rising. Chrome 4 is the highest produced chrome set by far. It’s also is the second highest modern set produced, since 2010, behind Book Worms. Collecting GPKs has changed over the past few years. That can easily be seen with the influx of new collectors and money into the hobby. The question now is, how long can Topps retain this demand for GPKs?
Finally, can we figure out how many base cards were produced? Not really, but we can use what we know and give it our best guess! I feel safe using 3.5 base cards per pack as a good number. Just over half the hobby packs per box has 3 cards. Many blaster packs seem to have 5 cards, which makes up for a higher percent of packs having a parallel. So we are going to use 3.5 base cards per pack.
Base Cards – 1,812,500 total packs * 3.5 base cards per pack = 6,343,750 Total Base Cards produced / 100 cards per set = 63,437 Total of each base card.
That’s 18,000 more base sets possible compared to Chrome 3!!! That’s a lot of shiny cards!