
This is Part 1 of a two part series on the production of 2019 Series 1 Garbage Pail Kids We Hate the 90’s. Part 2 will be posting soon.
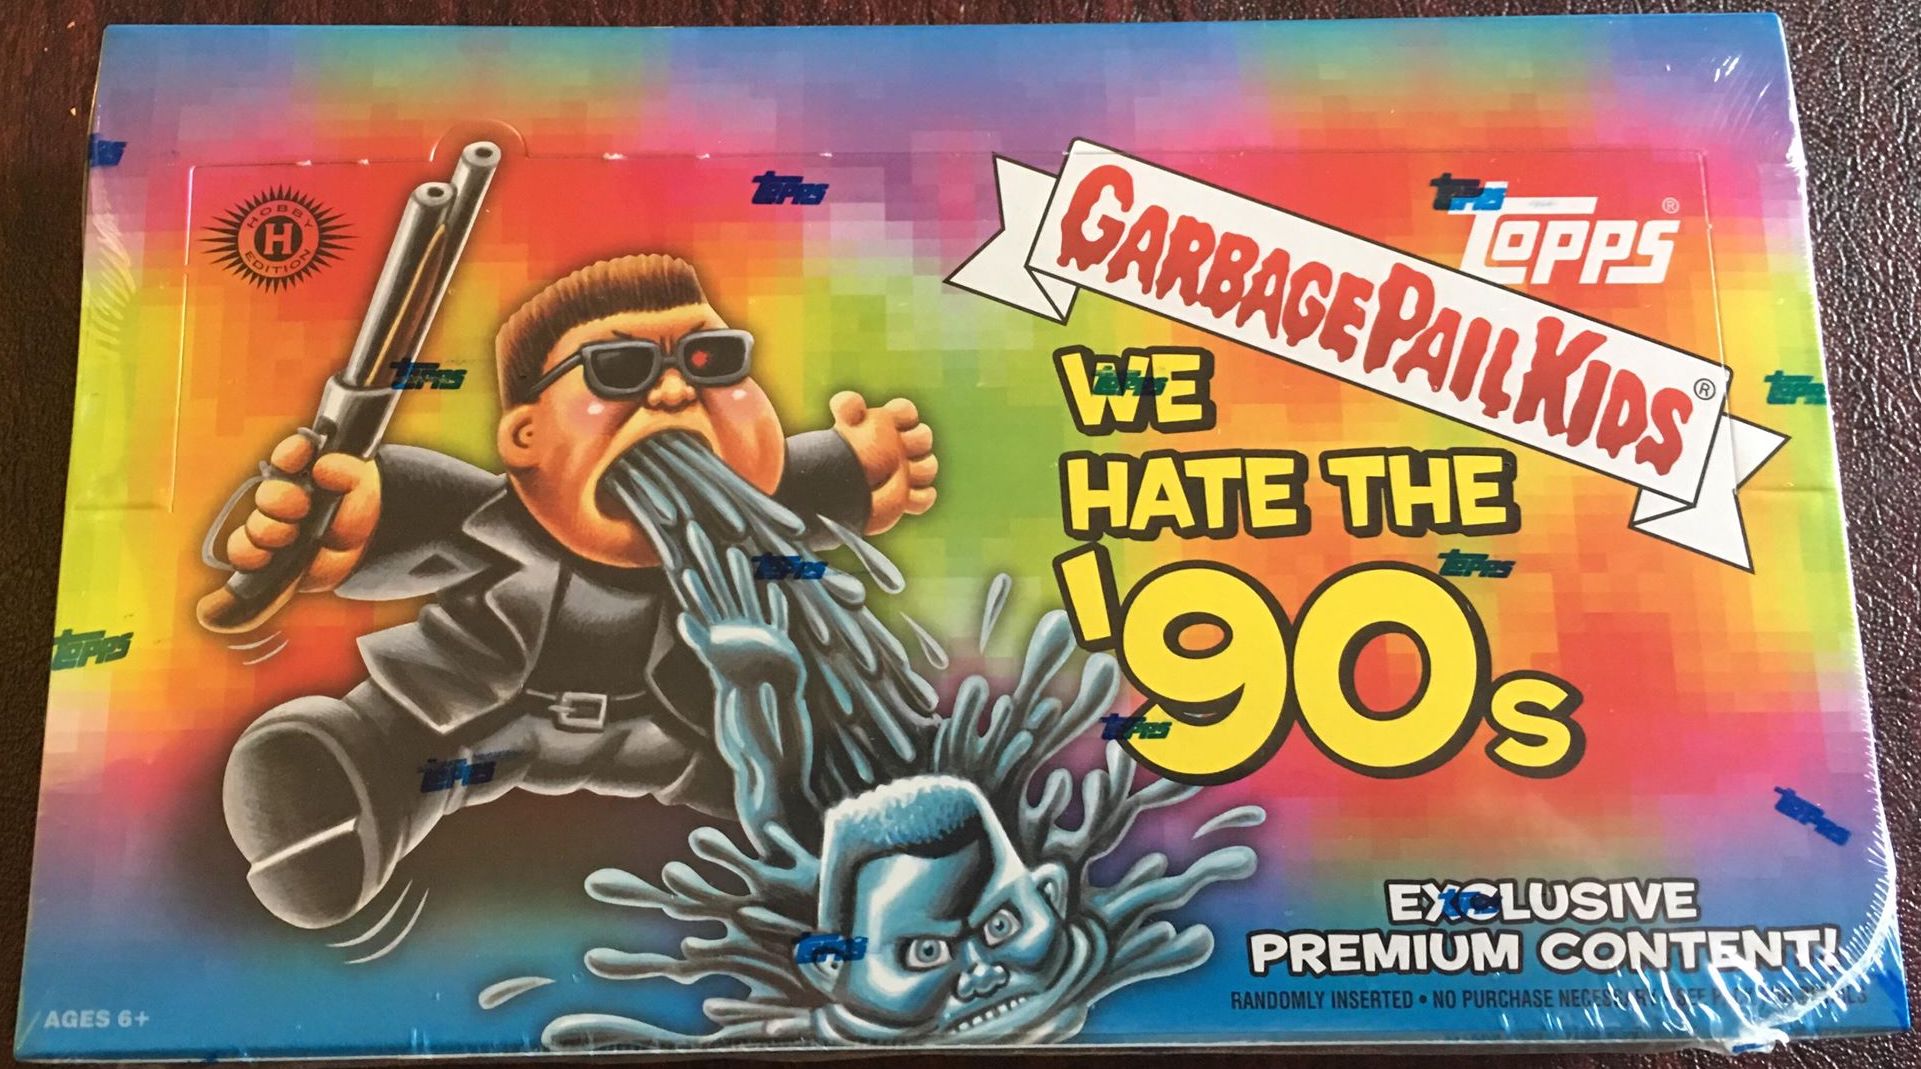 Coming off a highly successful 2018S2 Oh the Horror-ible set, Topps is following up with a sequel of sorts. This time Garbage Pail Kids are taking on the 90’s. Going into the set, collectors seemed to be apathetic towards the new offering. Would those feelings reflect in the production numbers? Once again Topps cancelled Target Gravity Feed boxes a week after offering them. This marks the second series in a row with no gravity feeds. Let’s delve into the numbers and see where this set ranks in terms of production.
First my disclaimer! Production numbers are never an exact science, and Topps makes it tough on us. In order to attempt to solve this riddle we need to look very closely at the clues in both the odds and the sell sheets. Some things to keep in mind for this post. 1) Topps doesn’t want the public to know exactly how much of each card was made. Why? No idea really, I think its dumb, but historically Topps only provides enough information to get close. 2) We need to make some assumptions. Those assumptions will be based on the clues we have, but still some guessing has to happen. 3) The odds never quite seem to come out completely equal. However, we can round and get pretty close to how much was produced. 4) Topps changes what is printed from what the sell sheet says all the time. This will throw off all our numbers. 5) Keep in mind Topps historically holds back up to 5% of the print run to cover missing hits, damaged cards, and their No Purchase Necessary program. These numbers would include that 5%. With all that in mind let’s get started…(Warning lots of math coming up. If you don’t want to read about the process, skip to the bottom for the answer sheet!)
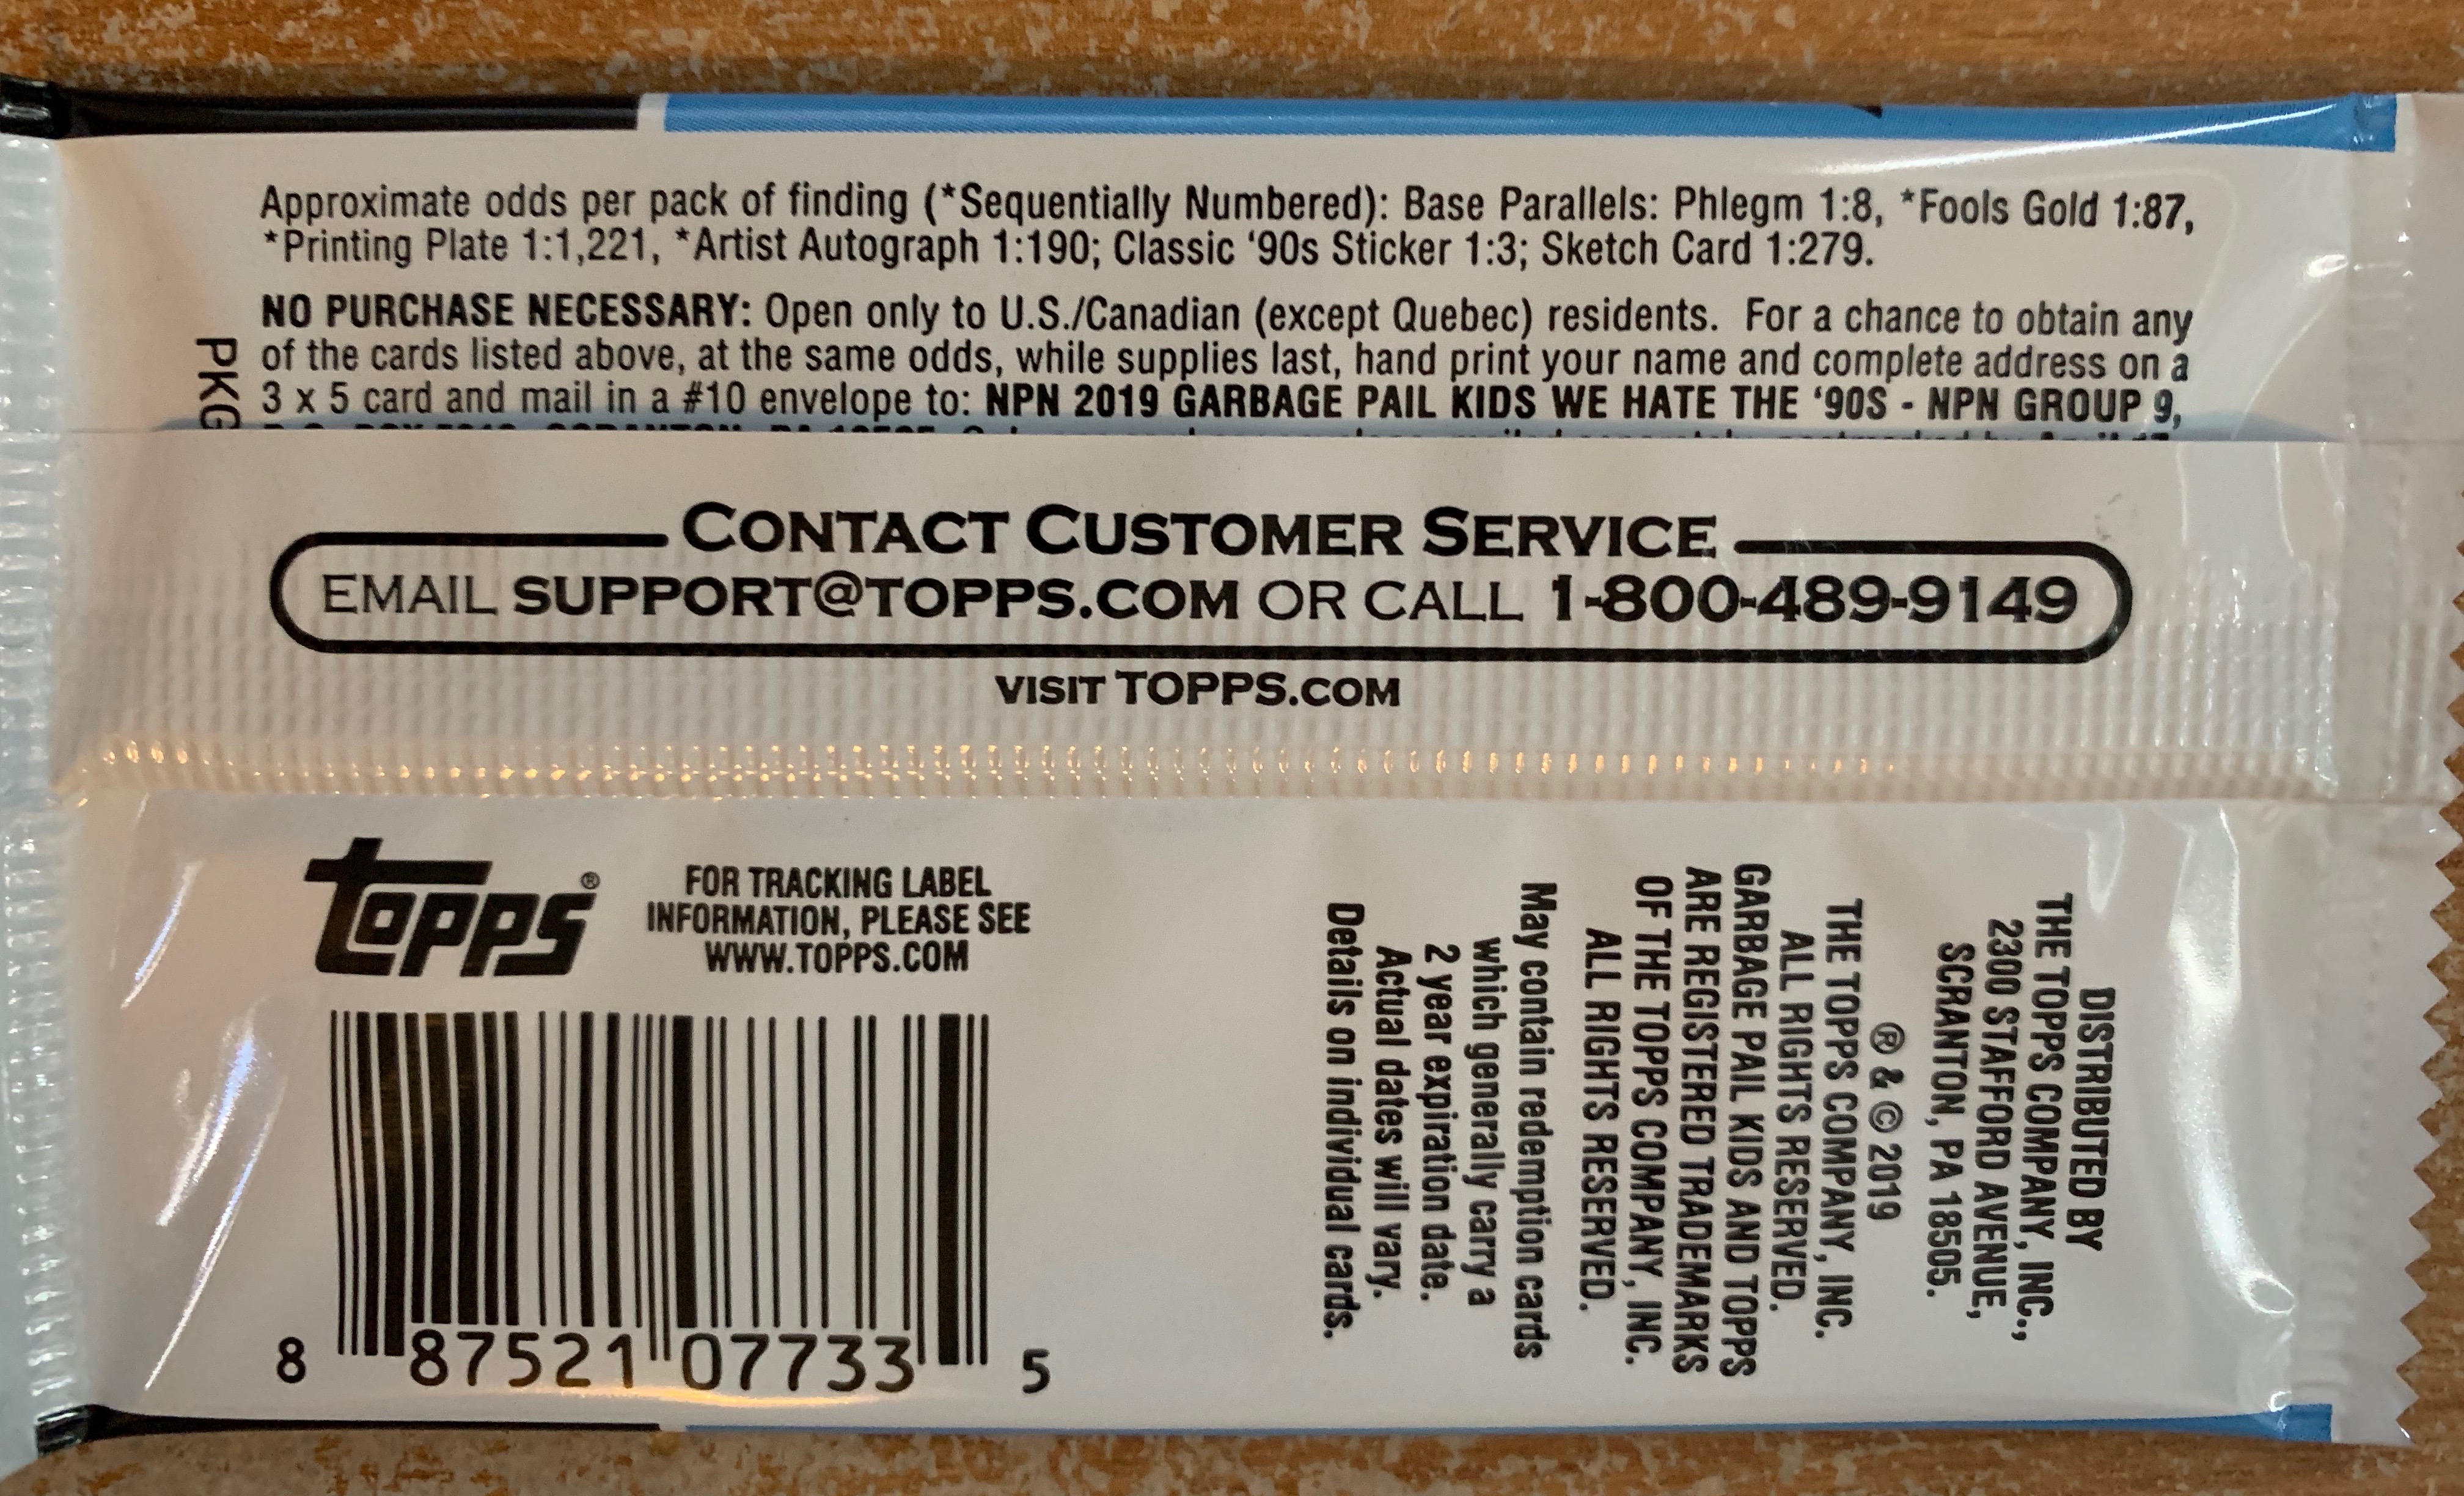
To start we need to determine how many packs were made for the entire print run. In order to do that we need a card type where all the odds are exactly the same in Collector and Retail/Hobby packs. In the past this was easy. Historically, Topps has used the same exact odds for both the Gold borders and the Artist autographs. With this set there are all kinds of problems with the odds printed in the packs. First off, odds for the parallels are at least overstated by double. This has happen before on GPK packs. This is especially true with the Gold borders. Based on actual pulls coming from multiple cases, I’m confident in saying golds are falling at twice the rate of the odds in Blaster, Hobby, and Collector packs. Fat packs is another story. The odds might be overstated by as much as 4 times, based on actual pulls from cases. If you take the odds and correct them, it puts production in line with the previous set, which makes more sense. Going forward in this article I will be citing the parallels odds 1/2 of what’s printed on the packs. For Fat Packs I will double the corrected odds to more closely align them with other retail packs, since they are roughly equal to two packs. However, this does make the odds off a bit, as fat pack odds are slightly easier than retail odds. This means production numbers are actually a little less than what’s stated in the article. It’s not a lot, but the numbers will be off.
Gold borders this time are set at 1:43 packs in Collector, Retail, and Blaster packs. The exception is Fat Pack retail packs, at 1:19, if we double those we still only get 1:38, which is slightly less that it should be. I will use the 1:43 number. There are 220 base cards in the set, and Gold borders are /50 on the back. Therefore, 220 X 50 number of golds per card = 11,000 total Gold borders X 43 odds = 473,000 total packs made for release. Interesting, it appears that production might be slightly up for this release.
 Can we be sure about 473,000 packs being made? We use to be able to double check by using Artist Autographs. However, this series the odds for autos are different across the board, and like with parallels I’m not completely convinced they are accurate. I don’t have enough data to show otherwise. We also can’t use plates for the same reason. We are going to go with the 473,000 as total number of packs. I think its the right number, and other calculations in the article show its a logical choice.
Next we need to try to figure out how many of each pack type was created for the set. Collector packs are always easier to figure out because they have the cards that are exclusive to the set. We need card types that are only in Collector packs, and we know already how many were made. Once again there are three types, Patches, Bloody Red borders, and Spit Blue borders. Here’s what the math looks like on those:
- Patch Cards – 20 cards in set X 50 made per card = 1000 total patches x 50 odds = 50,000 Collector packs made
- Bloody Red borders – 220 cards in set X 75 made per card = 16,500 total Red borders X 3 odds = 49,500 Collector packs made
- Spit Blue borders – 220 cards in set X 99 made per card = 21,780 total Blue borders X 2.5 odds = 54,450 Collector packs made
Once again Collector boxes are pretty easy to figure out. Sure the blue borders show a few more packs, but quite often the odds are rounded and not exact. That could account for the difference. It looks like its safe to assume 50,000 Collector packs were made. This shows a decrease in production for Collector packs. It makes sense, collectors were hyped for the Horror-ible series, not quite as much for this one. That shows in the production numbers. However, one important thing to note is that production is higher overall than most other recent sets.
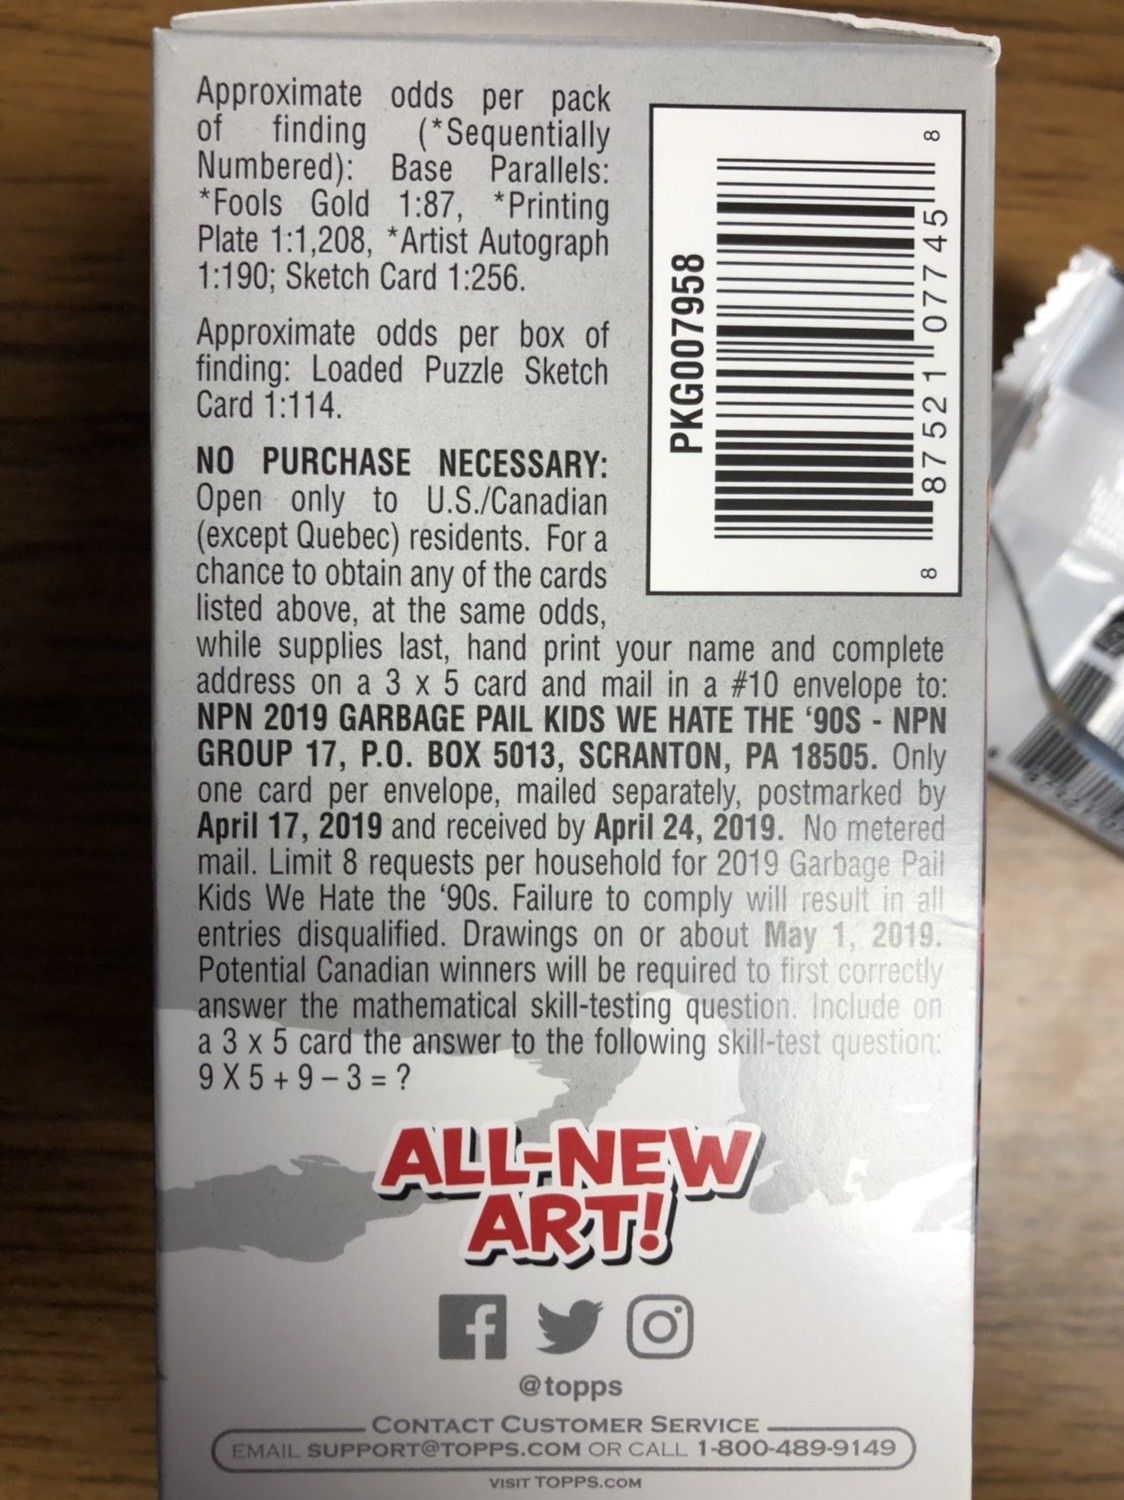 How about other pack types? Once again Hobby boxes are nonexistent, and exist in name only. Starting with Adam-Geddon Topps has made Hobby boxes the same as Regular Retail Display boxes. There are no longer any marks on the packs or boxes that distinguish a Hobby box vs. a Retail display box. Also, the odds are exactly the same. In order to determine how many different types of retail packs were made, we would need a card type that is only in one type of retail pack, and we know how many were made. In the past this has been near impossible. However, this time I’m going to give it a shot. The only card types that are individual to retail packs are Loaded Sketches and Panoramic Sketches. While Topps doesn’t release the number of sketches inserted, we have a good idea. Sketch artists were asked to do 5 Loaded and 3 Panoramic sketches. We also know, based on Topps checklist, that were were 56 sketch artists this series. In the past a multitude of factors didn’t allow me to use these numbers. Some times artists didn’t complete their sketches, or many were rejected by Topps, or Topps’ odds were just way off what makes sense. After running the numbers using the odds, and what we know about the sketches, the numbers look to match up. Let’s take a look.
- Loaded sketches – 56 artists * 5 sketches each = 280 total Loaded sketches * 114 odds per box = 31,920 Blaster boxes * 5 packs per box = 159,600 blaster packs
- Panoramic sketches – 56 artists * 3 sketches each = 168 total pano sketches * 656 odds = 110,208 Fat packs
Keep in mind for our calculations we count a fat pack as 2 retail packs. Therefore, for Fat packs we would use 220,416 as the number. I’m going to round that down to 220,000 for our calculations. I’m also going to round the Blaster pack number to 160,000.
We know there are 50,000 Collector packs. If total packs are 473,000 – 50,000 Collector packs = 423,000 retail packs. Let’s take it even further. 423,000 retail packs – 160,000 blaster packs – 220,000 Fat packs = 43,000 Hobby/Retail Display packs. Those seem like very plausible numbers. Is there a way to check those? Let’s use regular sketches. The odds for regular sketches very slightly. Blasters are 1:256, while Fat packs and Retail Display are both listed as 1:279. While the calculations won’t be accurate because of the variances, the numbers get close. 56 artists * 30 regular sketches each = 1680 total sketches * 279 odds = 468,720 retail packs. if you take out collector packs, and 1/2 the fat packs from that number, then add back in packs for the blaster odds being easier, the numbers are in the ballpark. When you think about it, the number make sense. Very few Hobby/Retail Display boxes, compared to all the blasters and fat packs available.
What do the numbers tell us? You will need to take some of these numbers, especially the retail breakdown, with a grain of salt. We had to make some assumptions and a leap of faith in the odds printed on the packs, which we know Topps isn’t accurate all the time. Tryptych sketch odds don’t even show up on Collector packs, instead Topps listed odds for Dual Artist Pano sketches, which don’t exist in the product! However, I think it’s safe to assume 473,000 as total pack production, and 50,000 as the Collector production.
Here’s what I believe the total production numbers to be for We Hate the 90’s:
- Total Production – 473,000 Packs
- Collector – 50,000 Collector Packs or about 2,083 Hobby Boxes or about 260 Collector Cases
- Blaster – 160,000 Blaster Packs or 32,000 Blaster boxes or 2,000 Blaster cases
- Fat Packs – 110,000 Fat Packs or 1,018 Fat Pack cases
- Retai Display – 43,000 Packs or 1791 Retail Display boxes or 224 Retail Display cases
Really interesting story for Topps this time around. Collector production is down. Makes sense because collectors liked the horror theme better, and didn’t order as much of We Hate the 90’s. Retail production however is up. That also makes sense. Retail is reactionary. They saw good sales of Oh the Horror-ible, so they ordered more of We Hate the 90’s. Production overall being up can’t be a bad thing for the brand. Let’s see where We Hate the 90’s stacks up against other recent sets.
- Total Pack Production
- Trashy TV – 638,000
- Adam-Geddon – 459,000
- Battle of the Bands – 441,000
- We Hate the 80’s – 439,000
- Oh the Horror-ible – 440,000
- We Hate the 90’s – 473,000 (7% increase in production vs. Oh the Horror-ible)
- Collector Pack Production
- Trashy TV – 35,000
- Adam-Geddon – 36,000
- Battle of the Bands – 41,000
- We Hate the 80’s – 39,000
- Oh the Horror-ible – 60,000
- We Hate the 90’s – 50,000 (17% decrease in Collector production vs. Oh the Horror-ible)
- Retail Pack Production
- Trashy TV – 550,000
- Adam-Geddon (Includes Hobby packs) – 423,000
- Battle of the Bands (Includes Hobby packs) – 400,000
- We Hate the 80’s (Includes Hobby packs) – 393,000
- Oh the Horror-ible – 380,000
- We Hate the 90’s – 423,000 (10.2% increase in Retail/Hobby production vs. Oh the Horror-ible)
Topps prints to order their product. Which means based on distributor pre-orders, Topps decides how much product to produce. As mentioned earlier overall production is up for We hate the 90’s. in fact it’s the largest produced set since Trashy TV. This is due to retail production. It will be fascinating to see what happens on the next GPK set later this year. Collector demand has not been as high for the newest set. Will that result in reactionary retail orders, and therefore lower production? Based on the next theme will Collectors purchase higher amounts? Really interesting to follow as the brand evolves.
This practice is always a lot of fun to look at. Let me know your thoughts on the numbers in the comments!
This is Part 1 of a two part series on the production of 2019S1 Garbage Pail Kids We Hate the 90’s. In Part 2 we will look at production numbers for all parallel and insert sets. Part 2 will be posted soon.
That’s incredible. Great work.
Pingback: How Many 2019S1 GPK We Hate the 90's Were Produced? Part 2 - GPKNews.com