
This is Part 1 of a 2 part series on the production of 2020 Series 2 Garbage Pail Kids 35th Anniversary. Part 2 will be posting soon.
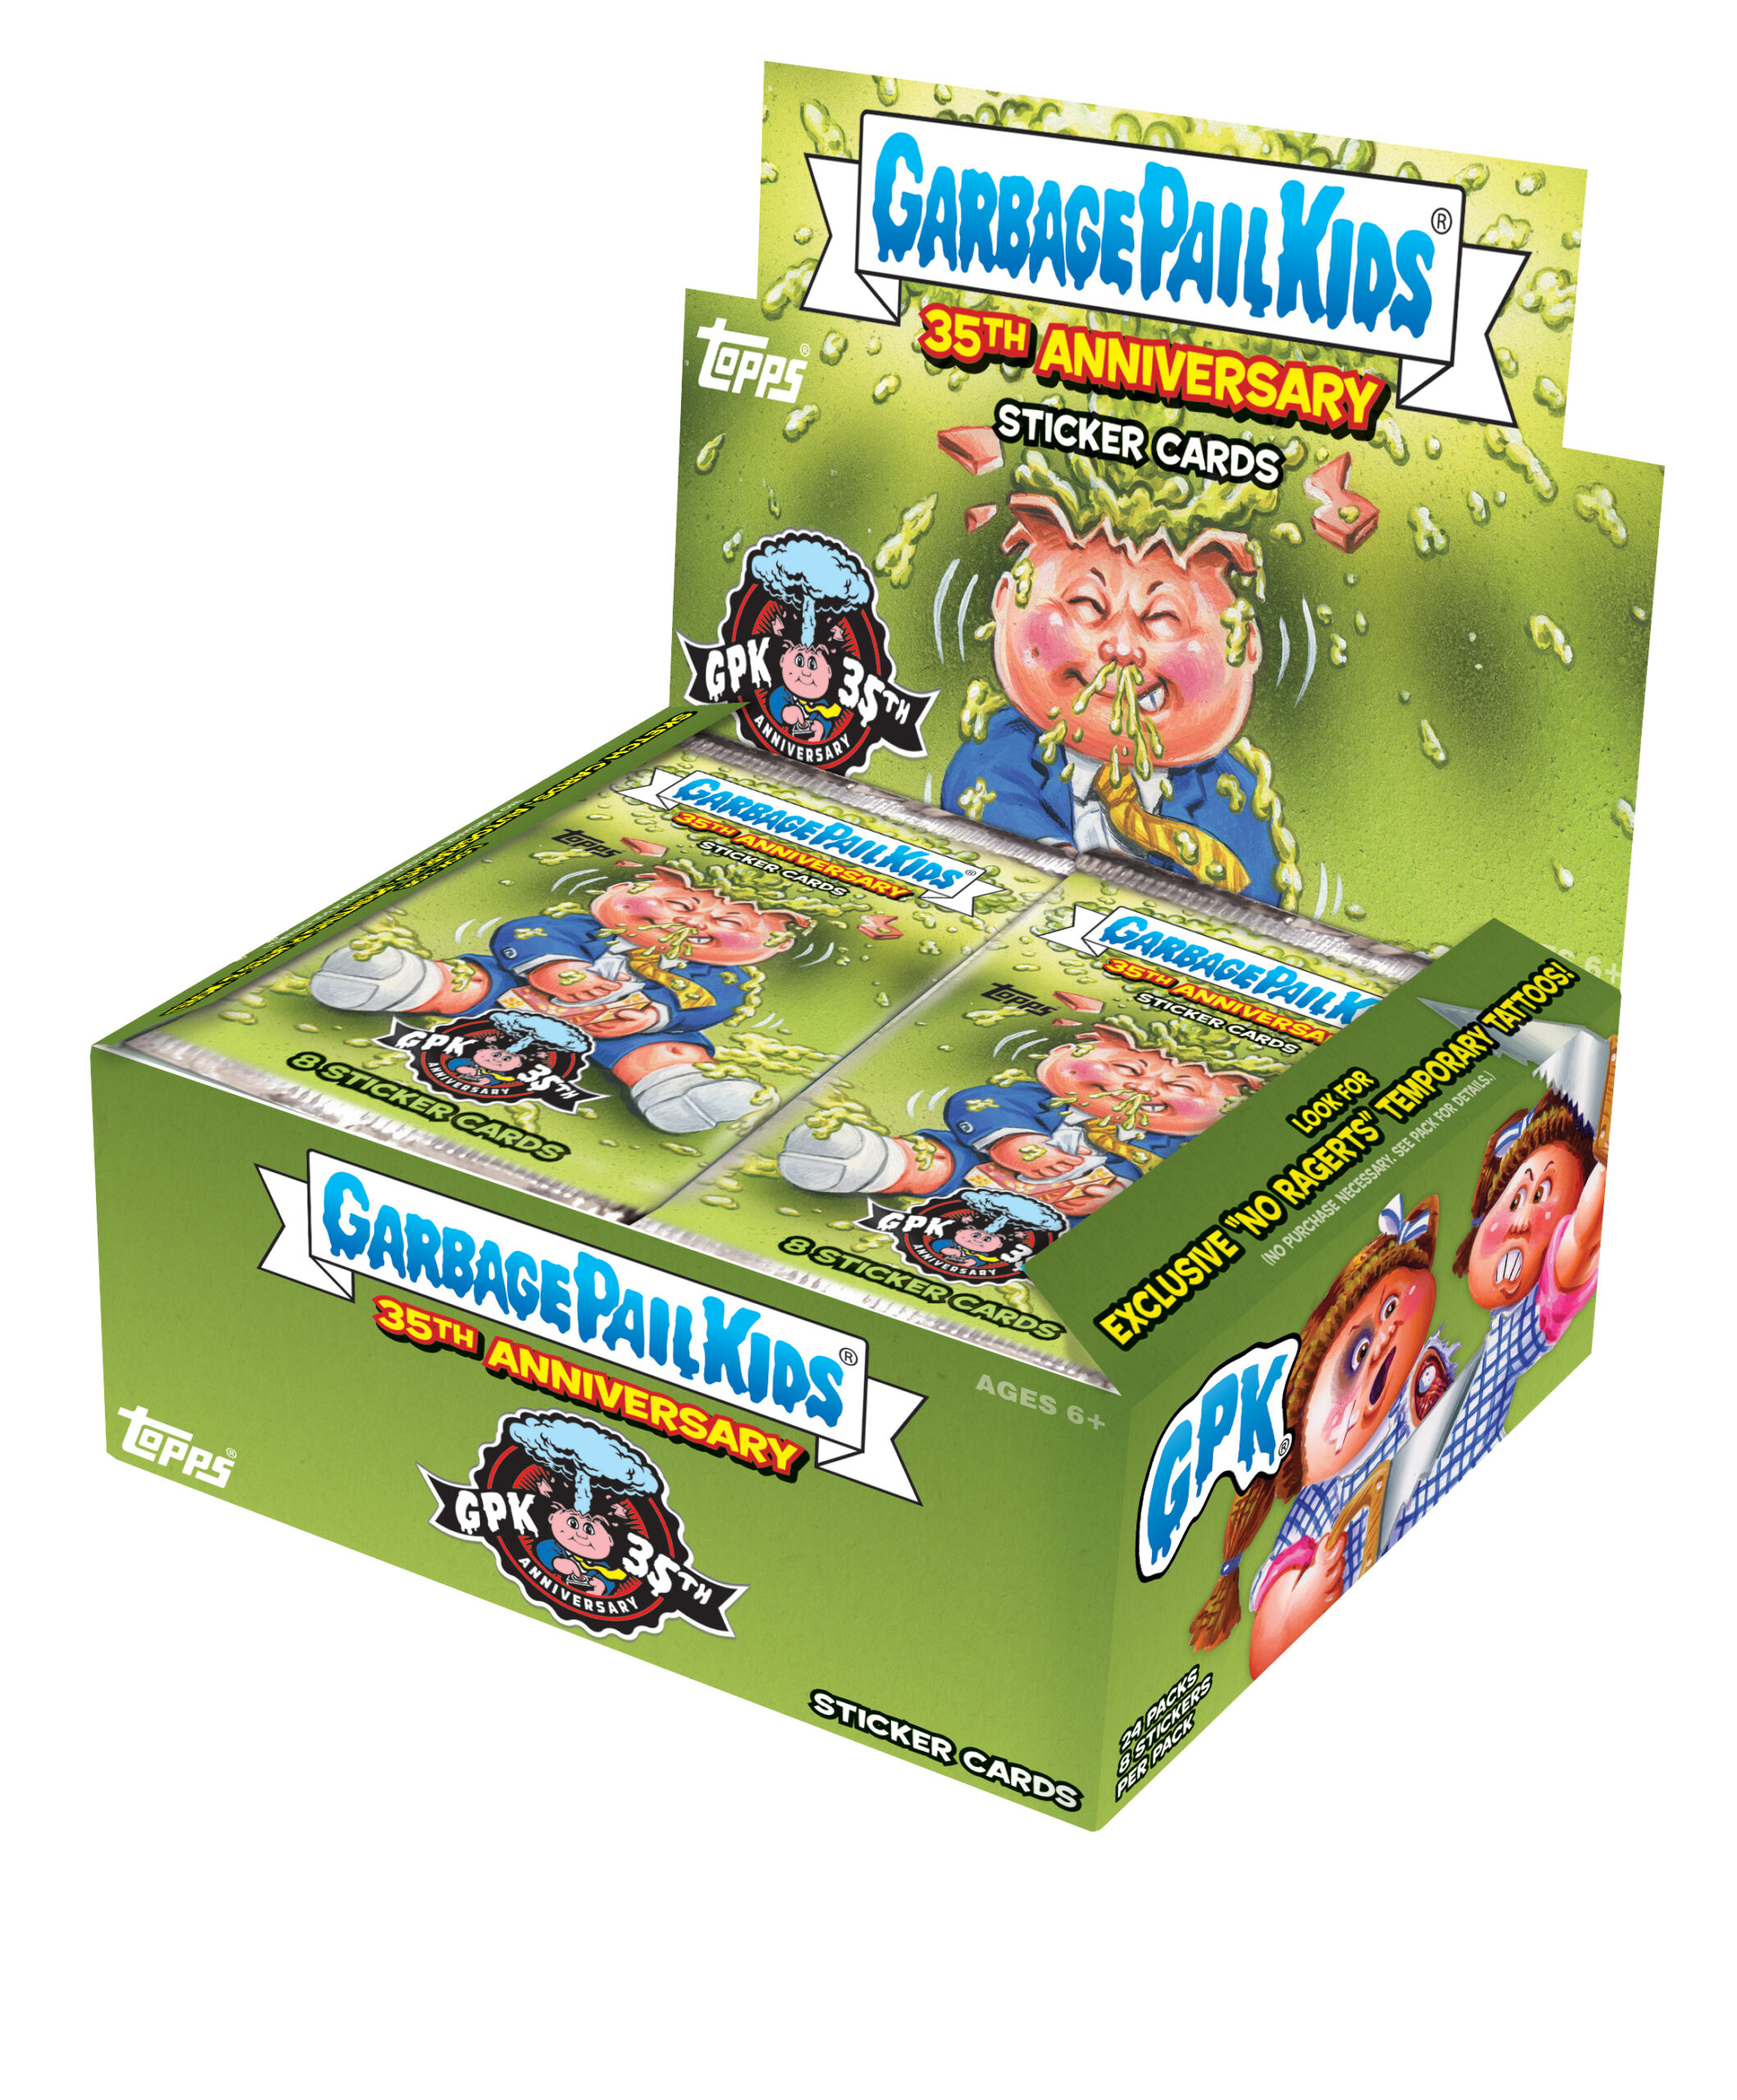 2020 has been defined by one thing, Covid-19. The collectibles market overall has responded huge during the pandemic. This is also true with Garbage Pail Kids. Secondary market demand for older sets and merchandise has reached heights previously unknown. So has demand for new product. 2020 also happens to be the 35th anniversary of GPKs. When you combine these two things, you get huge demand. How huge? Well, Topps delayed the set by a month. If I had to guess why, its because the printing presses had to run longer! There will be a theme in these production articles…production is up, up, up! As you’ll see, this is the highest produced set by Topps in 10 years. You have to go back to the BNS 1 days of 2010 to see production this high. Just how much was printed, and what does that mean for collectors? Let’s find out…
First my disclaimer! Production numbers are never an exact science, and Topps makes it tough on us. In order to attempt to solve this riddle we need to look very closely at the clues in both the odds and the sell sheets. Some things to keep in mind for this post. 1) Topps doesn’t want the public to know exactly how much of each card was made. Why? No idea really, I think its dumb, but historically Topps only provides enough information to get close. 2) We need to make some assumptions. Those assumptions will be based on the clues we have, but still some guessing has to happen. 3) The odds never quite seem to come out completely equal. However, we can round and get pretty close to how much was produced. 4) Topps changes what is printed from what the sell sheet says all the time. This will throw off all our numbers. 5) Keep in mind Topps historically holds back up to 5% of the print run to cover missing hits, damaged cards, and their No Purchase Necessary program. These numbers would include that 5%. With all that in mind let’s get started…(Warning lots of math coming up. If you don’t want to read about the process, skip to the bottom for the answer sheet!)
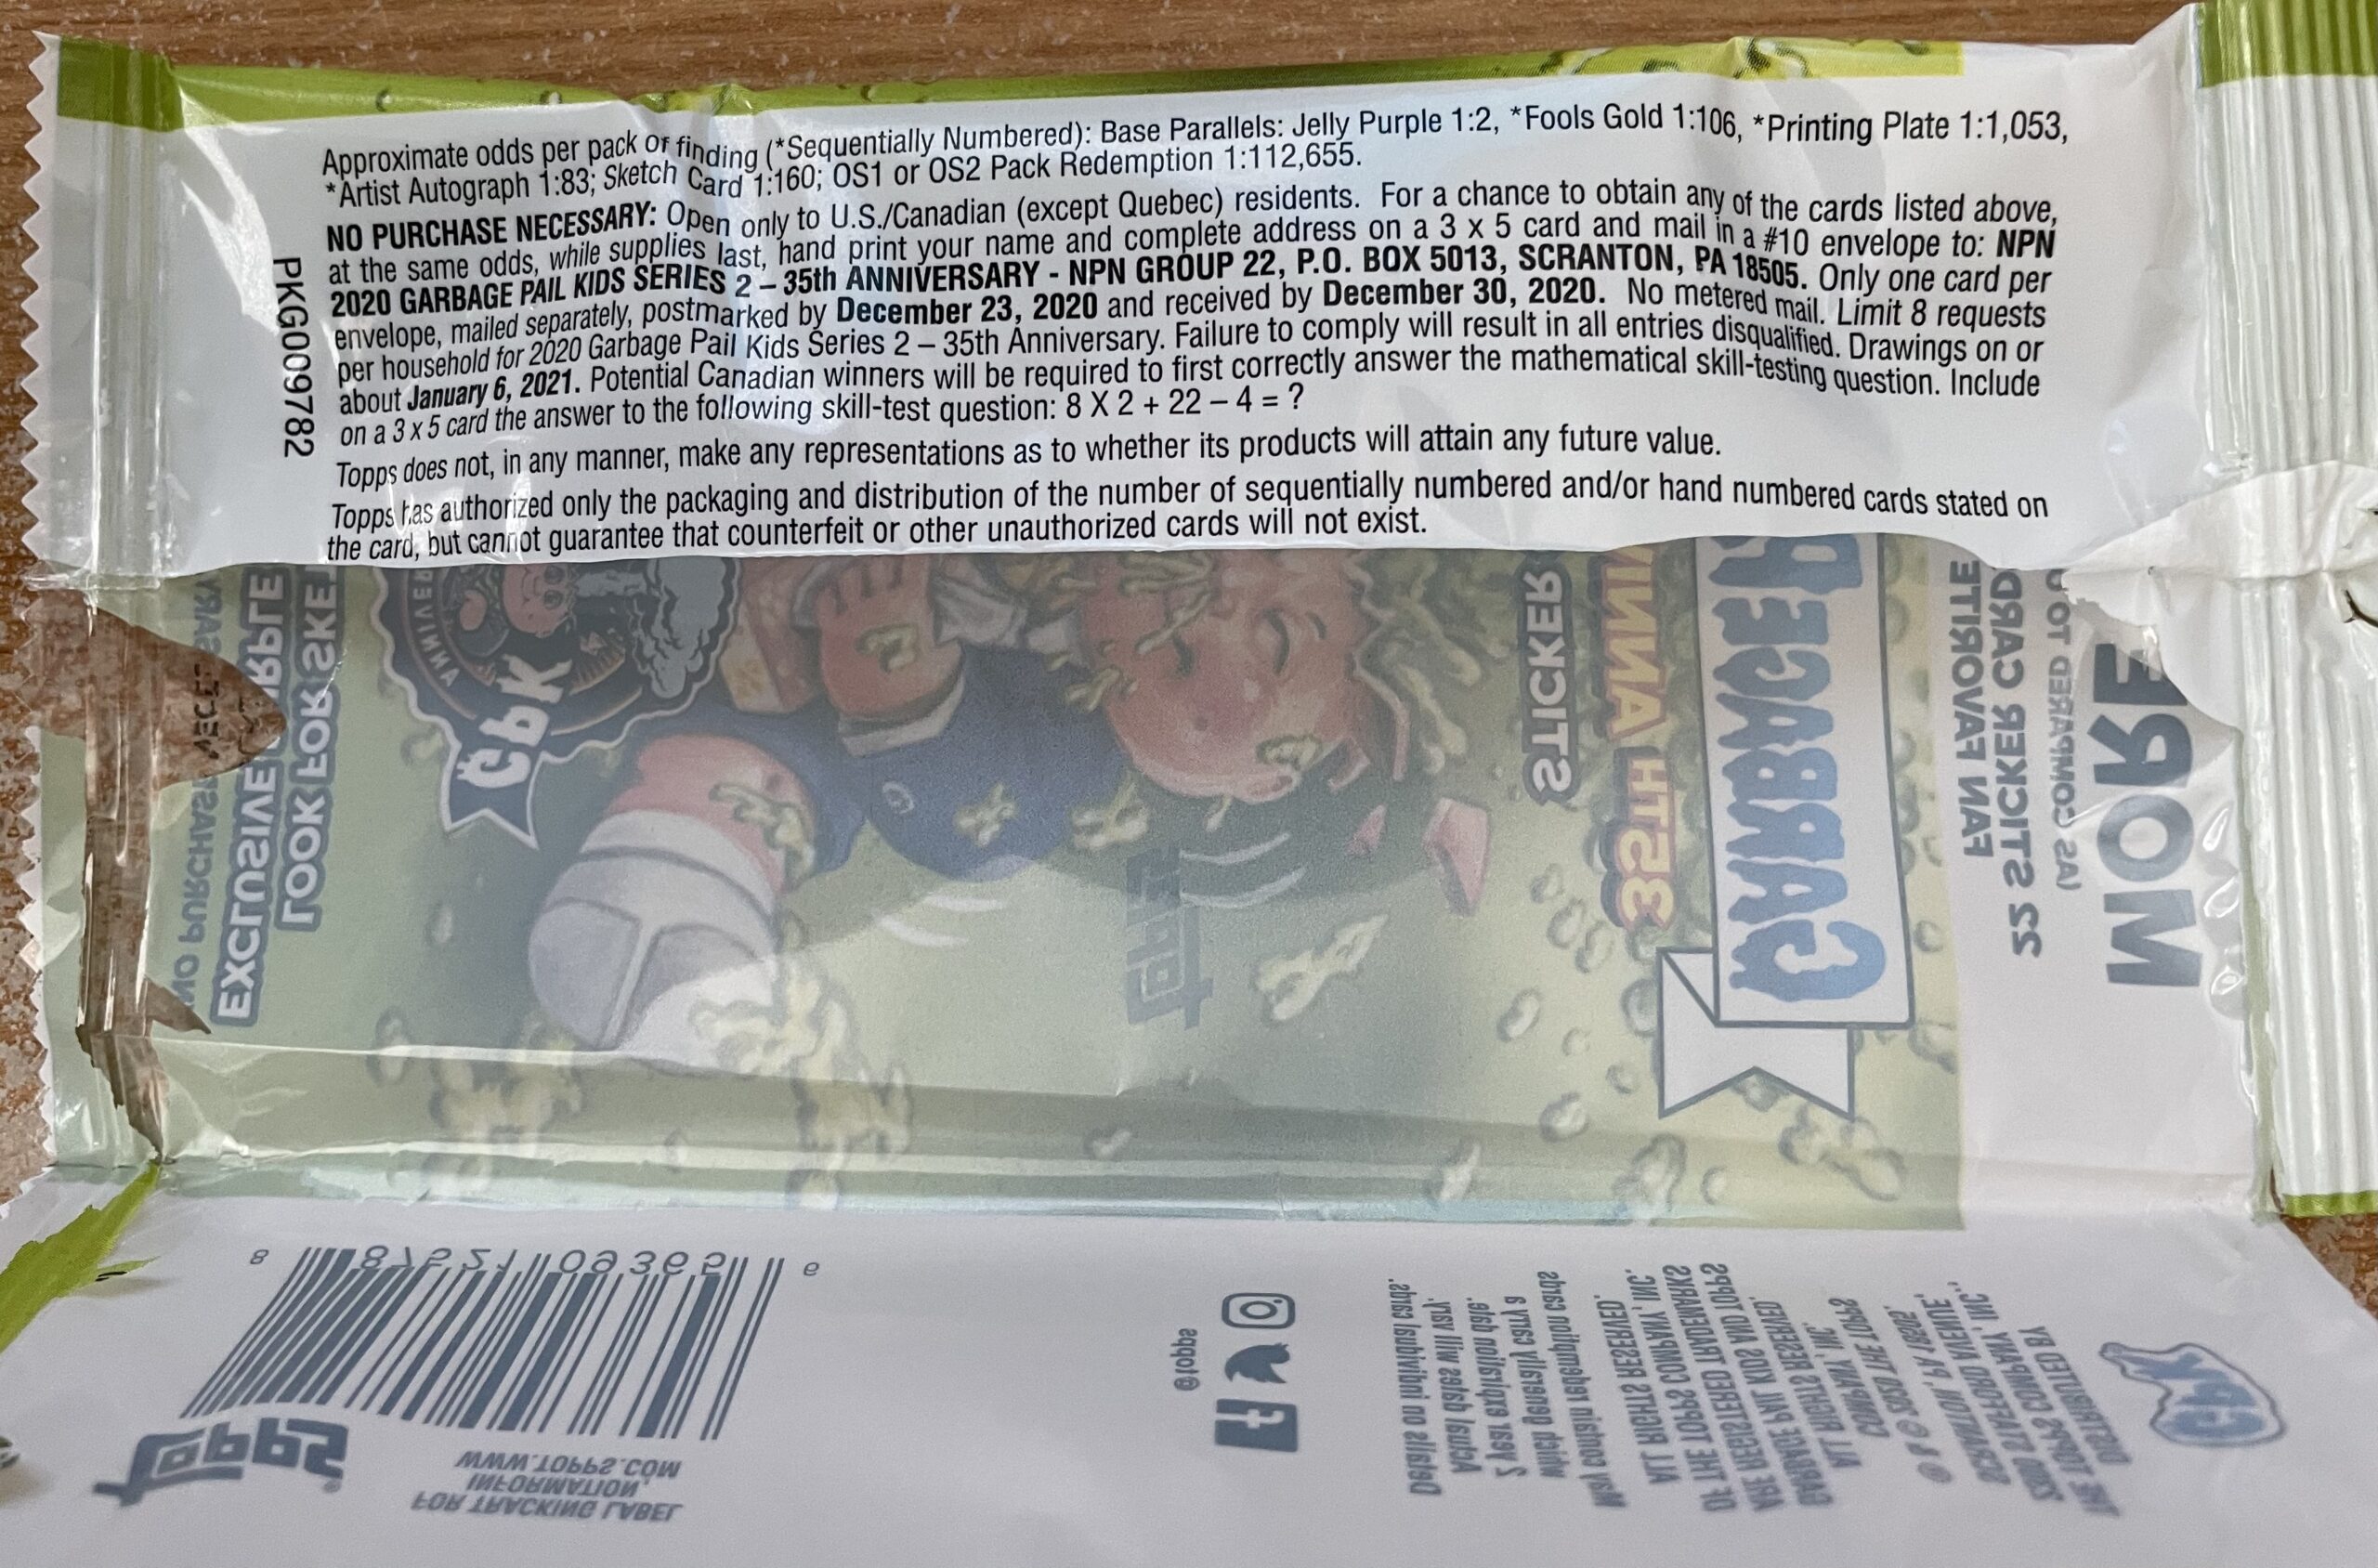
First thing we need to do is figure out how many packs were made for the entire print run. In order to do that we need a card type where the odds are exactly the same in all pack types. Once again, that holds true with the Gold parallels. However, there is one important thing to keep in mind. Once again, Topps has overstated the odds on the parallels by double. This happens almost every retail release. Topps even put Green odds on retail packs at 1:2, those come 1 per pack, always have, always well. Also after see many breaks, its obvious based on how many blues, reds, yellows, etc. are being pulled from boxes. I have a plea for Topps, get the odds right! Just keep in mind that going forward for this article the odds I quote for parallels will be the actual odds, which are 1/2 of what is printed on the packs. Another thing Topps has been consistent on the past couple releases is Fat Pack odds are once again 1/3 of retail packs. So for some of our calculations I’ll be counting Fat Packs as 3 retail packs.
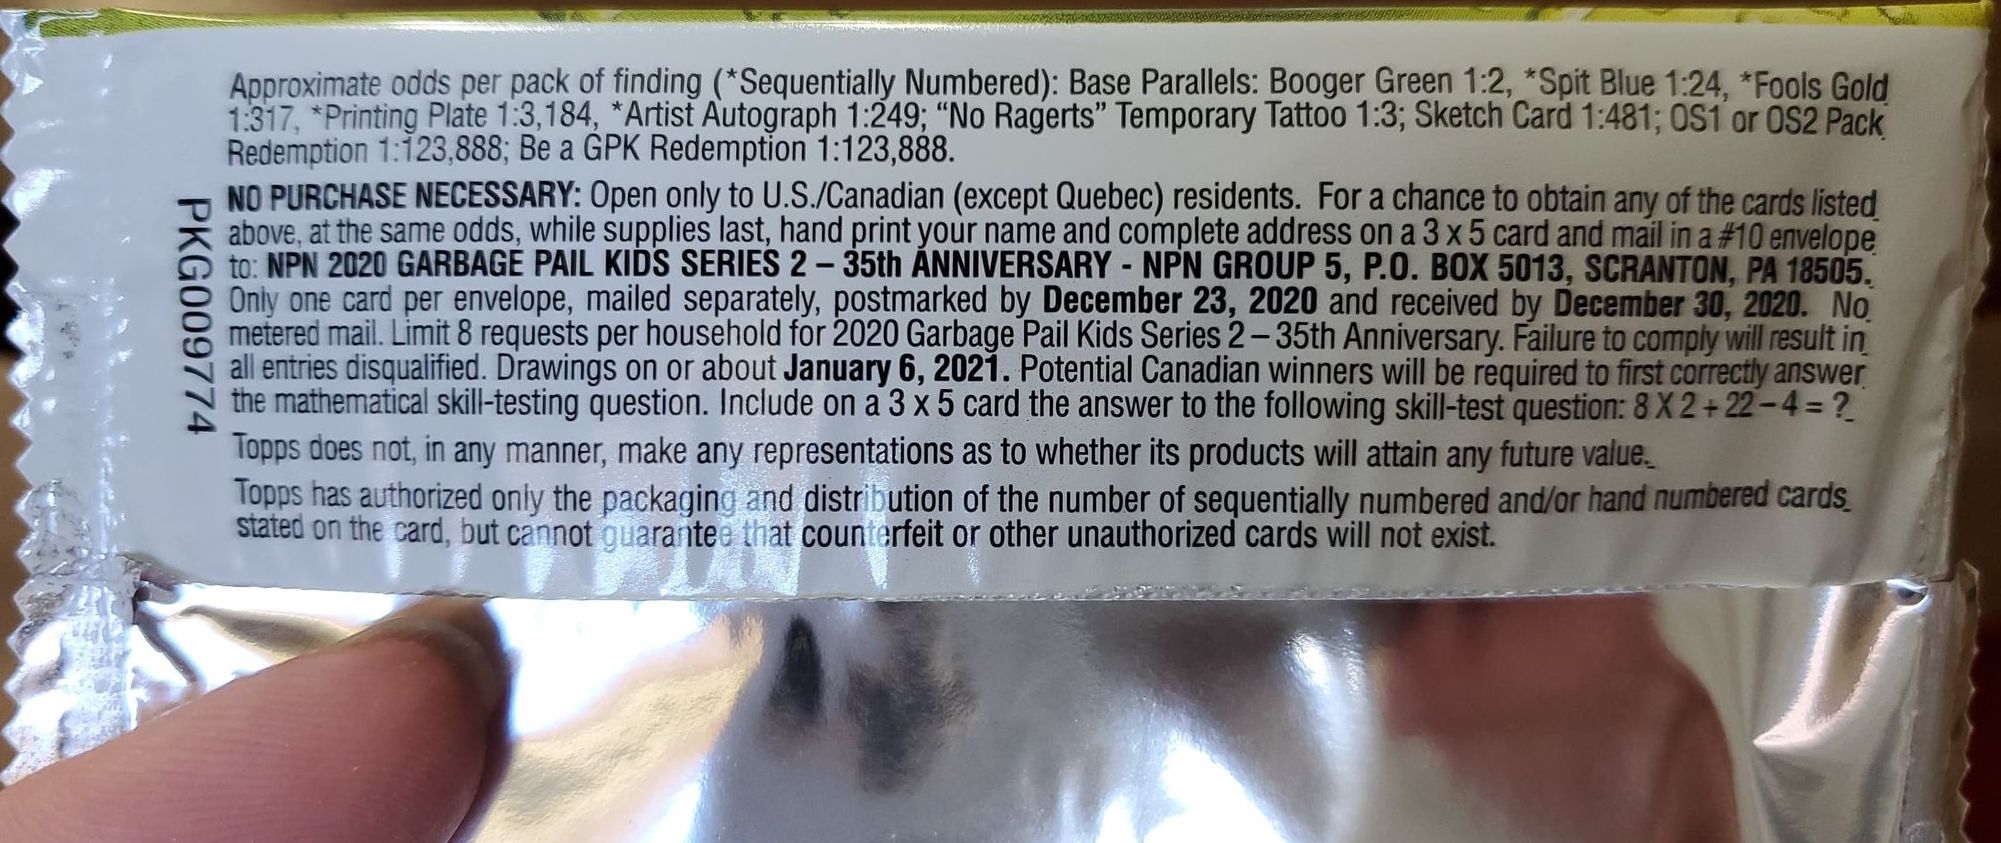 Gold borders this time are listed at 1:317 packs for Collector, Retail, and Blaster. Fat packs have them at 1:106. Again, since the odds are overstated by double. I’ll be using 1:159 as the more realistic odds. There are 200 base cards in the set, and this release Gold parallels are /35 on the back. Therefore, 200 * 35 number of golds per card = 7,500 total Gold borders * 159 odds = 1,113,000 total packs made for release. Wait, what?!?! There’s over 1 million packs!?!?!?! Holy crap that’s a lot of cards. That’s can’t be right, can it?
It’s right. Now, its hard for us to completely confirm this number because there are no other card type that has similar odds across all pack types. So let’s try to figure out how many of each pack type there are. Collector packs are always the easiest to figure out because there are certain exclusive numbered cards in Collector. We can check out Red borders and Relics.
- Relic Cards – 10 cards in set X 250 made per card = 2,500 total patches x 52 odds = 130,000 Collector packs made
- Bloody Red borders – 200 cards in set X 75 made per card = 15,000 total Red borders X 9 odds = 135,000 Collector packs made
Both of those numbers are pretty darn close, and give us a good starting point. I’m going to use the 130,000 number because I’ve noticed that a few breaks collectors pull 3 or 4 reds. Due to rounding, the odds might be slightly off on the reds. So I think it’s safe to use the 130,000 number for Collector packs made. Here’s our first clue production is up big, Collector production is up nearly double over the previous release! Was it the addition of the Garbage Can Tins? Just demand for the 35th set? A note on Collector production. The week before release, GTS Distribution, the largest card distribution company in the US, confirmed with GPKNews that Topps cut production on Collector boxes by 60%. E-mails to Topps for confirmation went unanswered. I only heard orders from one seller get cut. All other card companies were able to fulfill their orders as far as I can tell. I’ll let the readers draw their own conclusions. If production was cut we don’t know if the odds on the Collector packs were before or after the cut. I’m going to assume it was after the cut for our production discussion.
How about other pack types? In order to figure out the production of retail pack types we need a card type that is only offered in one retail pack type, and we need to know how many were made. Topps made some changes, and fix some problems from last release. So its actually easier than ever to figure out the various retail pack types. The easiest is the Retail Display box, (also sold a “Hobby” boxes). Topps moved the Blue borders to the Retail Display box for the first time this release, and we know those are numbered to /99.
- Spit Blue borders – 200 cards in set X 99 made per card = 19,800 total Blue borders X 12 odds = 237,600 Retail Display packs made
 Wow that’s a lot of Retail Display packs. Now let’s work on Blaster and Fat packs. Topps appears to have gotten it right this time. Both Loaded sketches and Panoramic sketches show up in Blaster boxes. We know there were 52 sketch artists complete sketches for this set. We also know how many of each sketch type Topps asked artists to complete.
- Loaded sketches – 52 artists * 6 sketches each = 312 total Loaded sketches * 314 odds per box = 97,968 Blaster boxes * 5 packs per box = 489,840 blaster packs
- Pano sketches – 52 artists * 3 sketches each = 156 total Loaded sketches * 2,590 odds per box = 404,040 Blaster packs
So again, wow that’s a lot of Blaster boxes! But given production is up so much, the numbers made sense. However, if you notice the two amounts are 85,000 apart if packs. Why is this, and which number should be use? Once thing to keep in mind on every release. There are some artists that don’t complete all their sketches, and only turn in some. There are also some that get destroyed in the process. In addition, the odds are always rounded, so that could account for some of the difference. Regardless there are a lot of Blaster boxes. So, what number should be go with? That takes some guess work, but for reasons that will be clear in Part 2 of the production article, I’ll be using the 404,040 number from the pano sketches. In a nut shell, using the lower number is the only way the Pack redemption odds on Fat packs makes any sense, see Part 2 for a longer explanation.
We know there are 130,000 Collector packs. If total packs are 1,113,000 – 130,000 Collector packs = 983,000 retail packs. Let’s take it even further. 983,000 retail packs – 237,600 Retail Display packs – 404,040 blaster packs = 341,360 / 3 = 113,786 Fat packs. With this release we can get a good idea how many packs of each different retail type there is. That will make figuring out the number of inserts in Part 2 a lot easier!
What do the numbers tell us? Quite simply Topps printed a ton of this set. There was a large demand from distributors and collectors for this set.
Here’s what I believe the total production numbers to be for Late to School:
- Total Production – 1,113,000 Packs
- Collector – 130,000 Collector Packs or about 5,416 Collector Boxes or about 677 Collector Cases
- Retail Display – 237,600 Retail Display Packs or about 9,900 RD Boxes or about 1,237 RD Cases
- Blaster – 404,040 Blaster Packs or 80,808 Blaster boxes or 2,020 Blaster Cases
- Fat Packs – 113,786 Fat Packs or 1,094 Fat Pack Cases
Production is way up for this set. when you compare it to anything released recently, there is nothing close. I went back quickly through all past sets where Topps printed odds and we can figure out production. This set is the second highest produced set, since BNS 1 in 2010, and the pack numbers are only a few thousand off of BNS 1. This is even bigger than Chrome OS1 or the 30th Anniversary sets. Let’s look at how production compares to other recent sets.
- Total Pack Production
- We Hate the 90’s – 473,000
- Revenge of Oh the Horror-ible – 748,000
- Late to School – 670,000
- 35th Anniversary – 1,113,000 (66% increase in production vs. LTS)
- Collector Pack Production
- We Hate the 90’s – 50,000
- Revenge of Oh the Horror-ible – 69,000
- Late to School – 74,000
- 35th Anniversary – 130,000 (76% increase in production vs. LTS)
- Retail Pack Production
- We Hate the 90’s – 423,000
- Revenge of Oh the Horror-ible – 679,000
- Late to School – 596,000
- 35th Anniversary – 983,000 (65% increase in production vs. LTS)
Its hard to put in perspective just how much was printed of 2020S2 35th Anniversary. Collectors opening packs will find longer odds than they’ve even seen when searching for sketches, plates and autos. At the same time these numbers are great for Topps and the GPK brand. Walmart and Target are both carrying the product. Demand is at a high that hasn’t been seen in years. This will lead to more GPK products in the coming months and into 2021. Chrome OS 3 is less than a month away. Collectors have shown a huge demand for that set. How will the success of the 35th Anniversary set play into the numbers for the Chrome set? We won’t have long to find out!
This is Part 1 of a 2 part series on the production of 2020 Series 2 Garbage Pail Kids 35th Anniversary. In Part 2 we will look at production numbers for all parallel and insert sets. Part 2 will be posted soon.