
This is Part 1 of a 2 part series on the production of 2020 Series 1 Garbage Pail Kids Late to School. Part 2 will be posting soon.
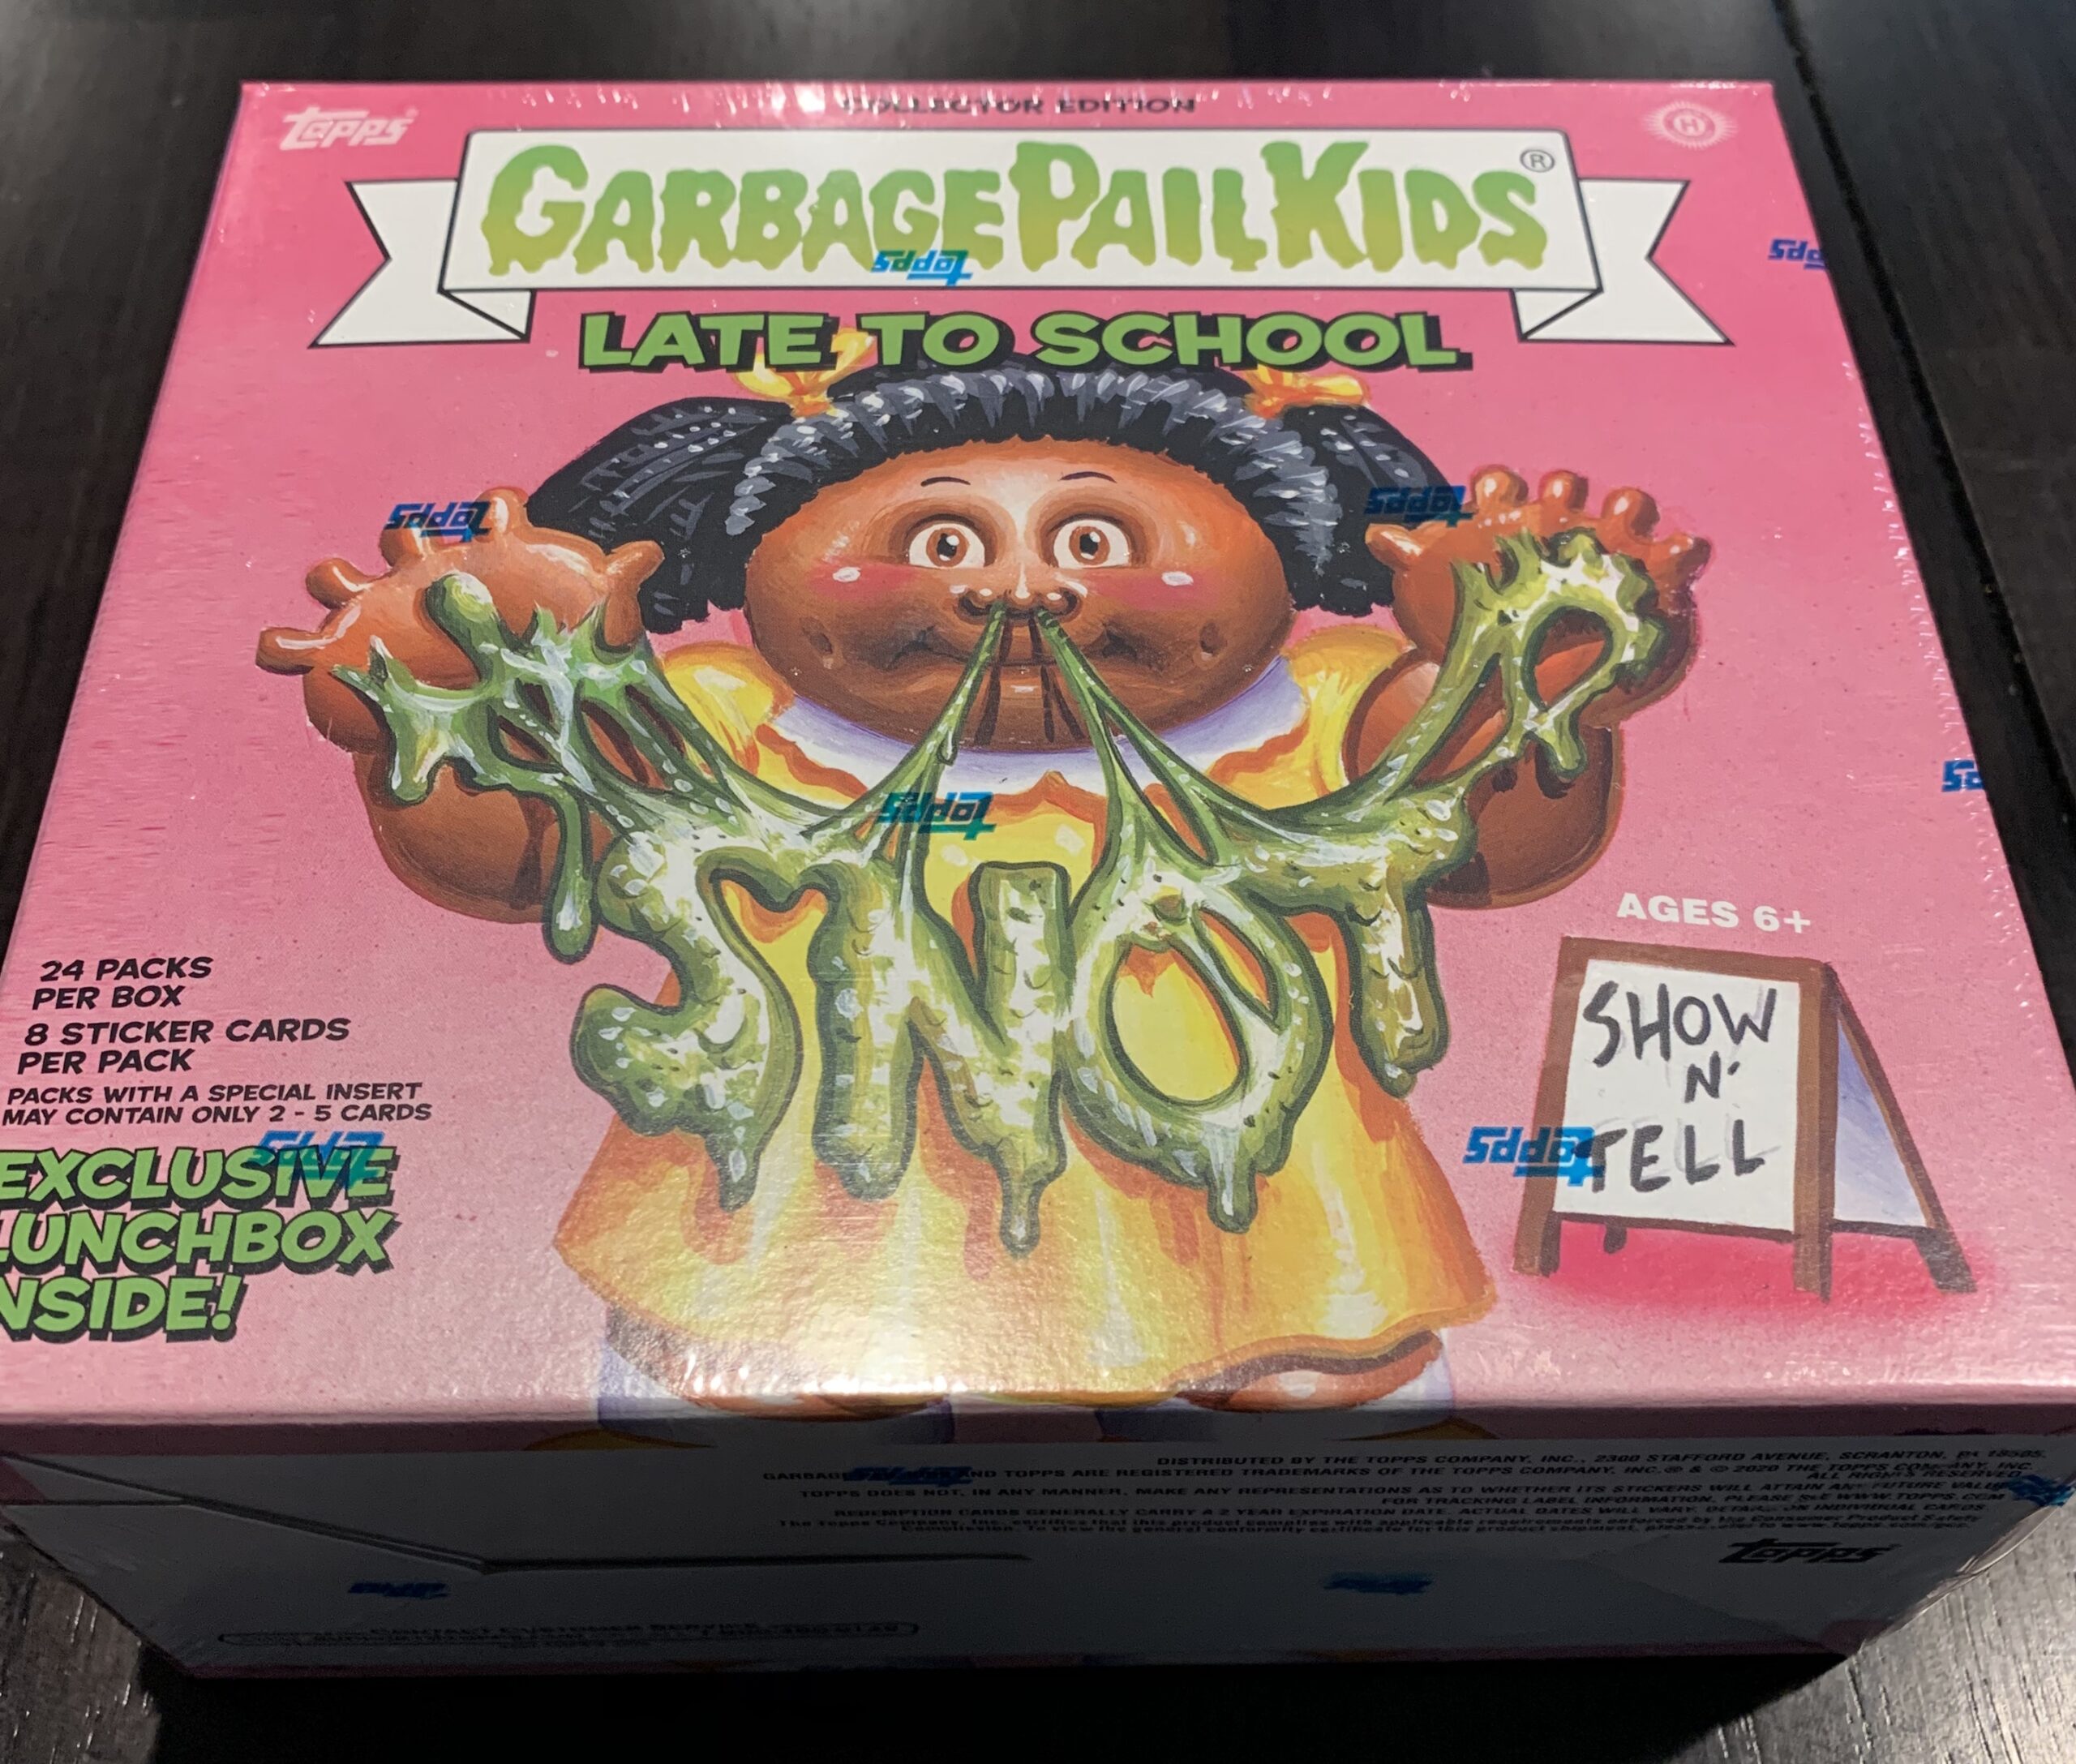 After two years of of sets based off of real people, Topps decided to change things up with 2020S1 GPK Late to School. Sales have been steadily increasing set by set with GPK. In fact 2019S2 was the highest produced GPK set in years. GPK collectors love their horror cards, and that showed with their purchasing power of 2019S2. so how would Topps keep collectors interested? Bring back card back art! Checklists, puzzles, and new card back art all make a return. The elimination of the frustrating subsets also was a collector plus. Was that enough to keep collectors buying GPKs? Distributors thought so, as Late to School’s production rivals that of 2019S2 Revenge of Oh the Horror-ible. Let’s take a look at just how many cards made.
First my disclaimer! Production numbers are never an exact science, and Topps makes it tough on us. In order to attempt to solve this riddle we need to look very closely at the clues in both the odds and the sell sheets. Some things to keep in mind for this post. 1) Topps doesn’t want the public to know exactly how much of each card was made. Why? No idea really, I think its dumb, but historically Topps only provides enough information to get close. 2) We need to make some assumptions. Those assumptions will be based on the clues we have, but still some guessing has to happen. 3) The odds never quite seem to come out completely equal. However, we can round and get pretty close to how much was produced. 4) Topps changes what is printed from what the sell sheet says all the time. This will throw off all our numbers. 5) Keep in mind Topps historically holds back up to 5% of the print run to cover missing hits, damaged cards, and their No Purchase Necessary program. These numbers would include that 5%. With all that in mind let’s get started…(Warning lots of math coming up. If you don’t want to read about the process, skip to the bottom for the answer sheet!)
As always we need to start by determining how many packs were made for the entire print run. In order to do that we need a card type where the odds are exactly the same in all pack types. One thing where 2020S1 Late to School is very similar to 2019S2 Revenge is the pack structure. This will make the method to figuring out production almost identical to 2019S2. Once again Topps has overstated parallels by double. Why Topps does this, I have no idea. But all parallels, reds, blues, yellows, golds, etc. are actually being pulled at 1/2 the rate stated on packs. Going forward, in this article I will be using 1/2 of the stated odds on packs for parallels. Another consistency from 2019S2 is Jumbo odds are 1/3 the odds on retail packs. So once again I will be counting a Fat Pack as 3 packs for our calculations.
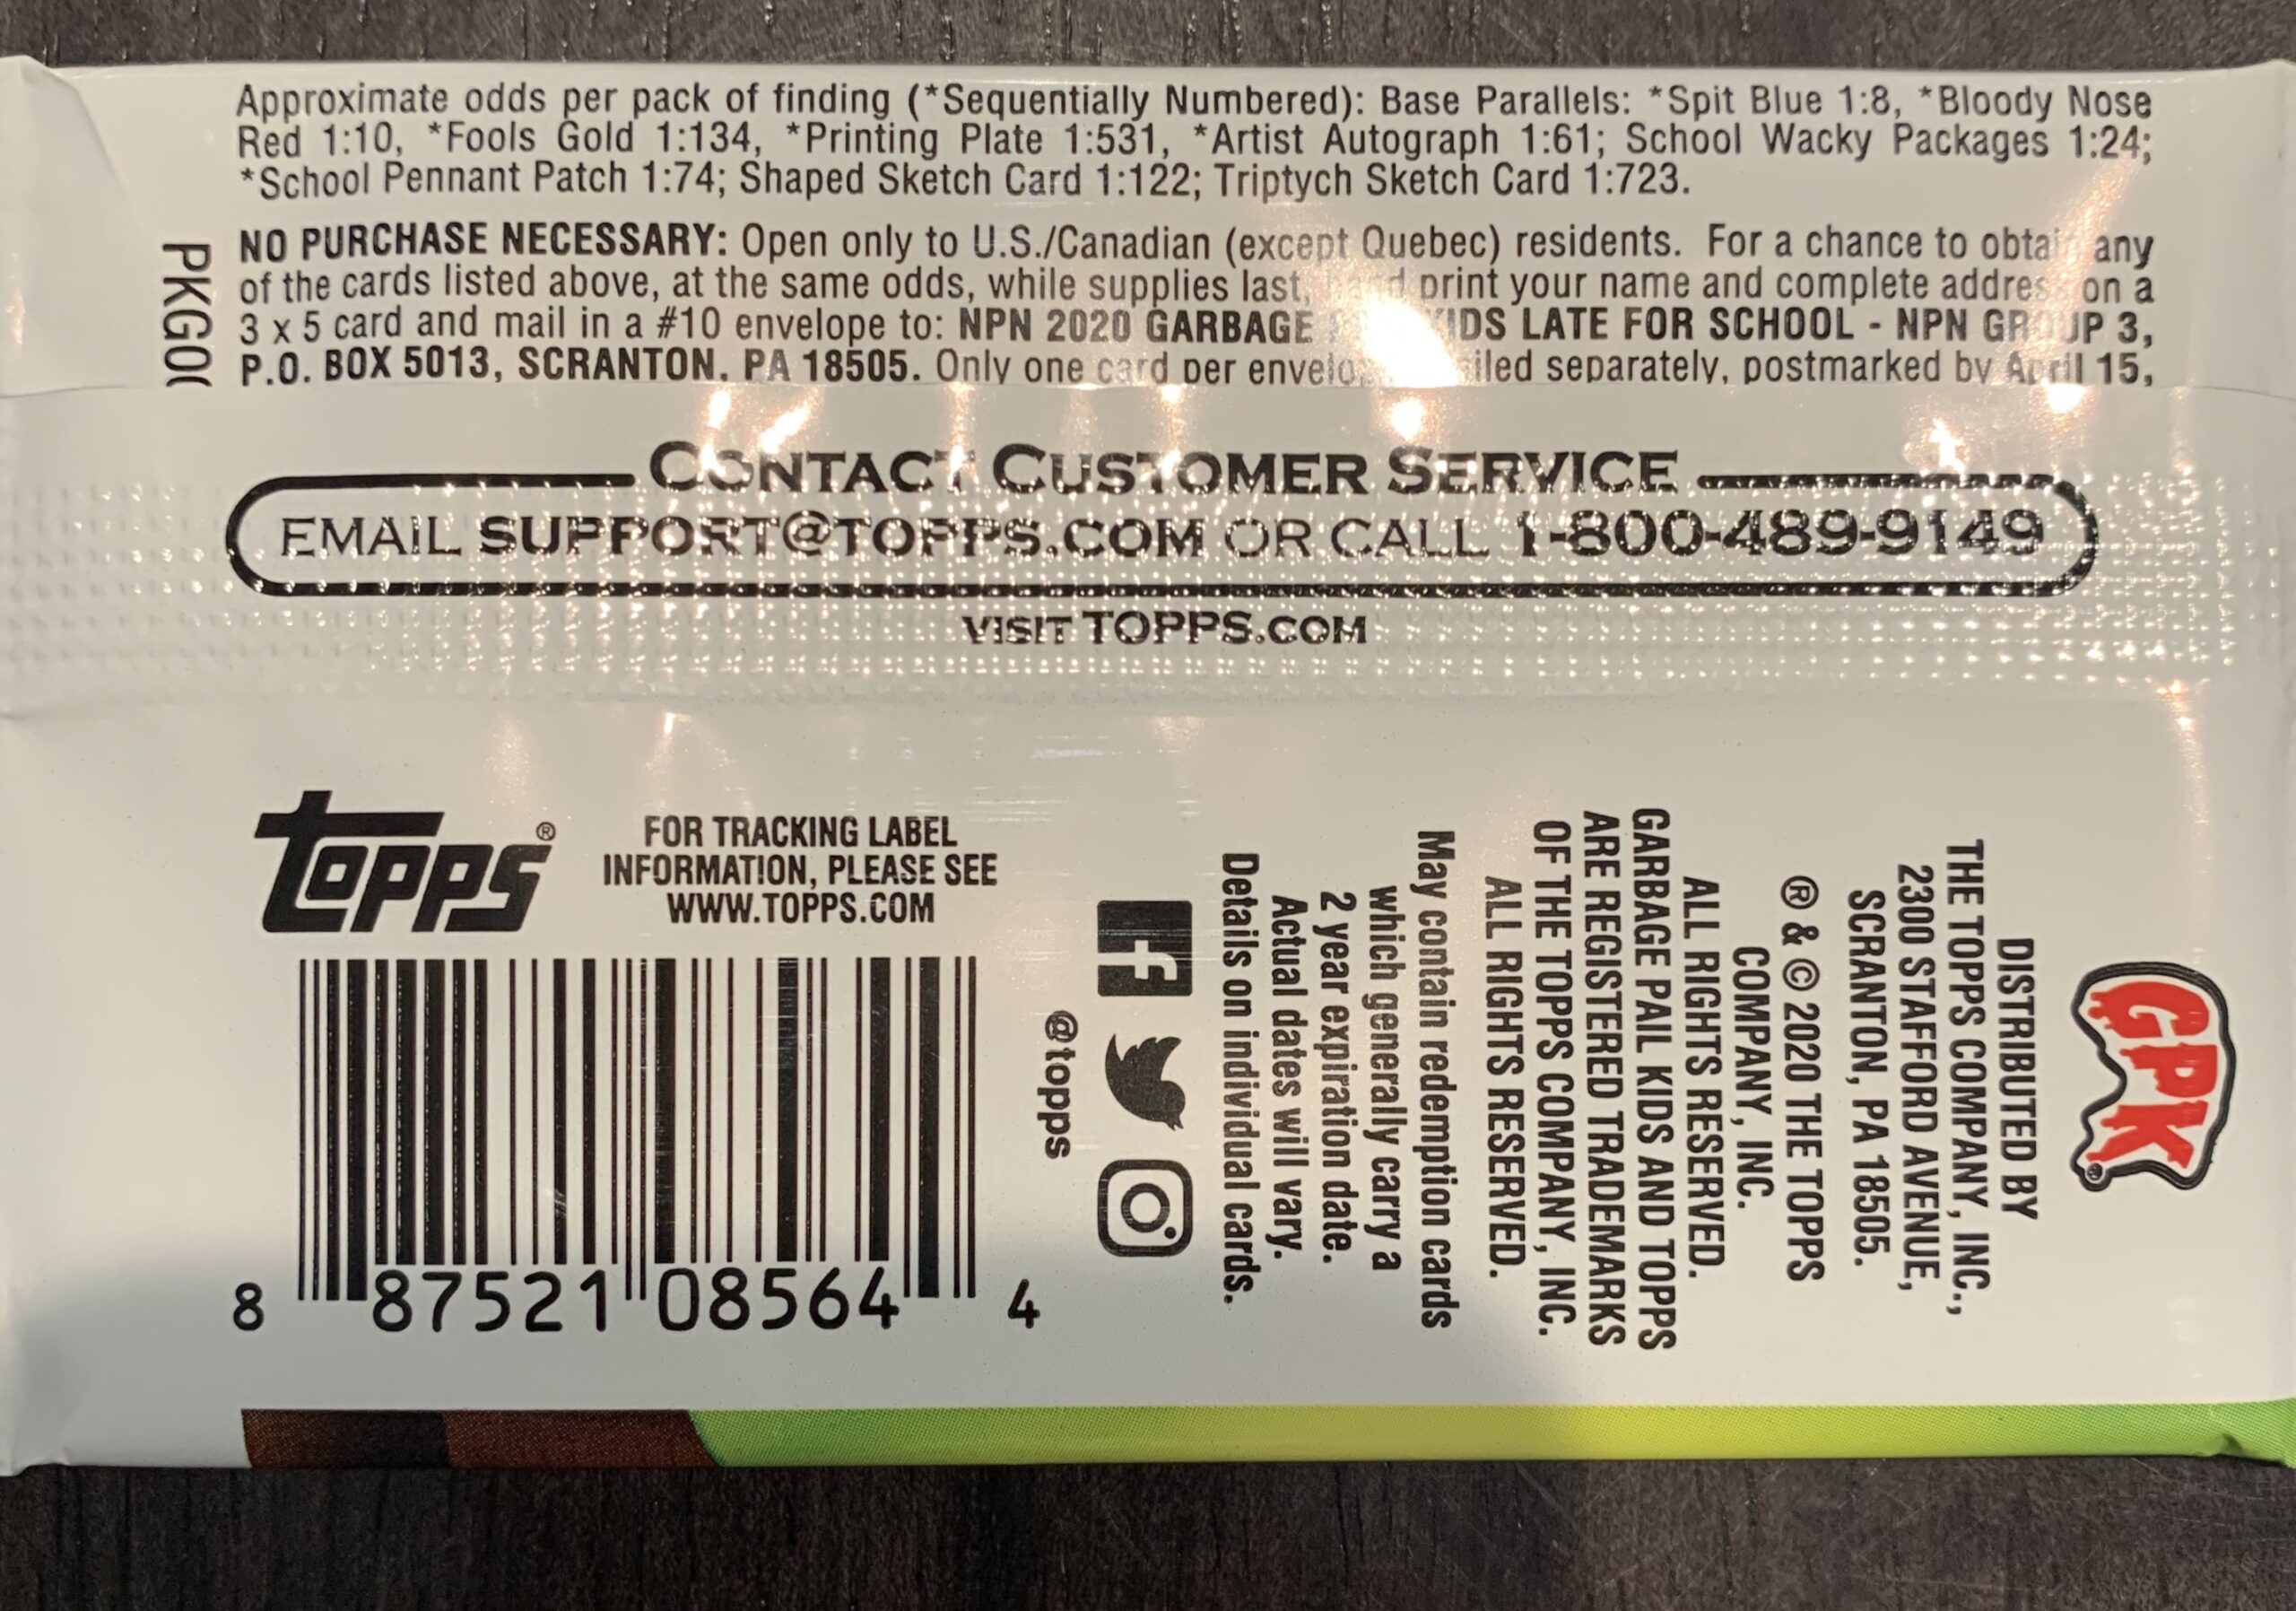 Gold borders this time are set at 1:134 packs in Collector, Retail, and Blaster packs, and 1:45 in Fat packs. Since the odds are overstated by double I’m going to use 1:67 as the more realistic odds. There are 200 base cards in the set, and Gold borders are /50 on the back. Therefore, 200 X 50 number of golds per card = 10,000 total Gold borders X 67 odds = 670,000 total packs made for release. That’s a lot of packs once again. It puts Late to School just under total pack production compared to 2019S2.
How can we be sure 670,000 is the right number? It’s hard because Topps no longer has any other card types with similar odds across the packs. Instead let’s try to reverse check our number and see if it makes sense. Let’s try to figure out how many of each pack type there are. Collector packs are always easy. There are a lot of card types only found in Collector packs. Relics, Red borders, and Blue borders are all things we can use. Let’s look at the math on those:
- Patch Cards – 10 cards in set X 100 made per card = 1000 total patches x 74 odds = 74,000 Collector packs made
- Bloody Red borders – 200 cards in set X 75 made per card = 15,000 total Red borders X 5 odds = 75,000 Collector packs made
- Spit Blue borders – 200 cards in set X 99 made per card = 19,800 total Blue borders X 4 odds = 79,200 Collector packs made
Once again Collector boxes are pretty easy to figure out. Sure the blue borders show a few more packs, but quite often the odds are rounded and not exact. That could account for some of the differences. It looks like it’s safe to assume 74,000 Collector packs were made. This shows Collector pack production is even up over 2019S2 Revenge! It’s not surprising, the lunchboxes that were included with each Collector were a big hit.
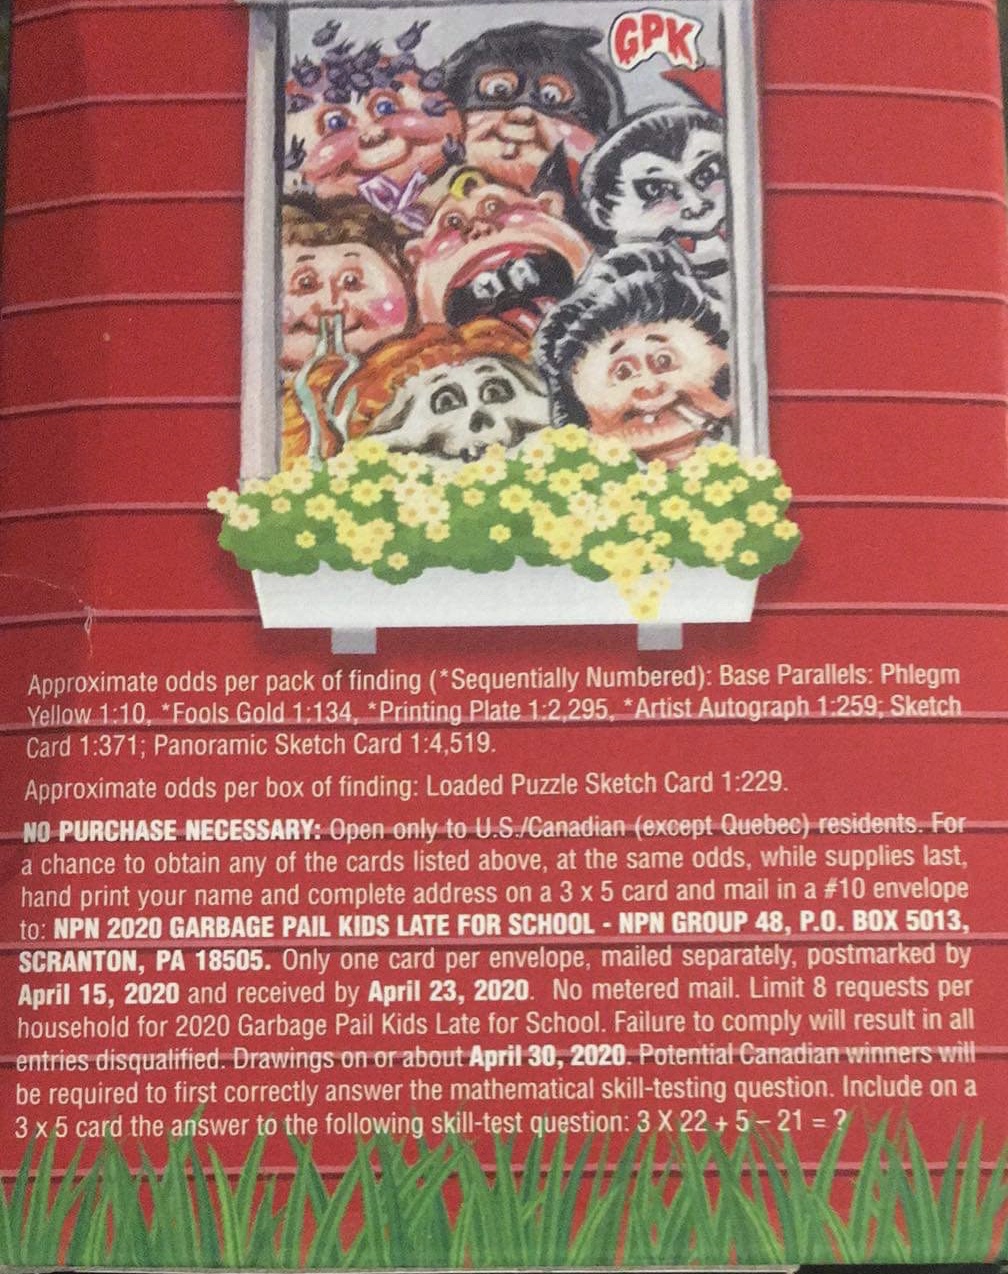 How about other pack types? In order to determine how many different types of retail packs were made we would need a card type that is only in one type of retail pack, and we know how many were made. The past couple of releases I used Loaded and Panoramic sketch numbers. Sadly, this isn’t possible this set. Topps were suppose to move Panoramic sketches to Value Box packs. However, pano sketches actually were inserted into Collector boxes. This left Fat packs and Retail display packs with no special cards that we know the print run of. Therefore, we are unable to break down the retail production this time. However, we can figure out how many Value Box packs, since Loaded sketches appear in those, and we know how many artists there were. We know there were 44 artists that completed sketches for this set. While the official Topps checklist shows only 41, there were 44 that confirmed to GPKNews they did sketches. Some of these sketches have started showing up on eBay. So we will assume the Topps checklist is incorrect.
- Loaded sketches – 44 artists * 5 sketches each = 220 total Loaded sketches * 229 odds per box = 50,380 Blaster boxes * 5 packs per box = 251,900 blaster packs
That pack number makes alot of sense given total production is down just a bit compared to the 2019S1 release. While that number won’t help us in this article, we will use it in part two to figure yellow border production numbers. We are going to go with a total production pack run of 670,000.
We know there are 74,000 Collector packs. If total packs are 670,000 – 74,000 Collector packs = 596,000 retail packs. Let’s take it even further. 596,000 retail packs – 252,000 blaster packs = 344,000 Fat packs/Retail Display packs. We can’t break down the difference between Fat Packs and Retail Display packs. However, I think its safe to assume the numbers are very similar to 2019S2, just slightly lower. However, without any actual numbers to go off of we won’t be able to figure out that information. However, let’s look at regular sketches. 44 artists + 36 regular sketches = 1,584 total sketches * 371 odds across retail – 587,664. That’s very close to the 596,000 number we came up with for retail packs. I believe our total pack numbers are very close.
What do the numbers tell us? Garbage Pail Kids continue to see a popularity they haven’t seen in years. Topps has been working overtime to print these sets. Once again this set has huge production.
Here’s what I believe the total production numbers to be for Late to School:
- Total Production – 670,000 Packs
- Collector – 74,000 Collector Packs or about 3,083 Hobby Boxes or about 385 Collector Cases
- Blaster – 252,000 Blaster Packs or 50,400 Blaster boxes or 1,220 Blaster Cases
- Fat Packs/Retail Display Packs – 344,000
Production is down, but it’s not by a lot. After the hugely successful 2019S2 set, retail partners have continued to order GPK product. There are also more than just Target stores carrying the product. Multiple national outlets carry GPK now. Let’s look at how production compares to other recent sets.
- Total Pack Production
- We Hate the 80’s – 439,000
- Oh the Horror-ible – 440,000
- We Hate the 90’s – 473,000
- Revenge of Oh the Horror-ible – 748,000
- Late to School – 670,000 (11% decrease in production vs. Revenge)
- Collector Pack Production
- We Hate the 80’s – 39,000
- Oh the Horror-ible – 60,000
- We Hate the 90’s – 50,000
- Revenge of Oh the Horror-ible – 69,000
- Late to School – 74,000 (7% increase in production vs. Revenge)
- Retail Pack Production
- We Hate the 80’s (Includes Hobby packs) – 393,000
- Oh the Horror-ible – 380,000
- We Hate the 90’s – 423,000
- Revenge of Oh the Horror-ible – 679,000
- Late to School – 596,000 (12% decrease in production vs. Revenge)
Once again production is very high for 2020S1 Late to School. There is a decrease from 2019S2, but in the grand scheme of things this is still the second highest produced set in years. The numbers are just over that of the 30th anniversary set. Once again collectors are going to be frustrated when looking for hits like sketches, plates, and autos. They will be very hard to come by once again. However, the expansion into multiple retail outlets shows promise for 2020. This sets Topps up nicely for the 35th anniversary celebration planned the entire year. Sure we won’t get the 35th set until late this year. However, Chrome is scheduled to come sometime this summer. It will be interesting to see how the recent popularity of GPK will affect ordering from retail partners for chrome.
This practice is always a lot of fun to look at. Let me know your thoughts on the numbers in the comments!
This is Part 1 of a 2 part series on the production of 2020 Series 1 Garbage Pail Kids Late to School. In Part 2 we will look at production numbers for all parallel and insert sets. Part 2 will be posted soon.
Pingback: How Many 2020S1 GPK Late to School Were Produced? Part 2 | GPKNews.com