
This is Part 2 of a two part series on the production of 2019S1 GPK We Hate the 90’s. If you missed Part 1 you can go here to catch up.
 In the first post we looked at how many packs/boxes/cases were produced of 2019S1 Garbage Pail Kids We Hate the 90’s. Here’s a review of what we came up with.
- Total Production – 473,000 Packs
- Collector – 50,000 Collector Packs or about 2,083 Hobby Boxes or about 260 Collector Cases
- Blaster – 160,000 Blaster Packs or 32,000 Blaster boxes or 2,000 Blaster cases
- Fat Packs – 110,000 Fat Packs or 1,018 Fat Pack cases
- Retai Display – 43,000 Packs or 1791 Retail Display boxes or 224 Retail Display cases
I’ll be using these numbers to try to come up with an idea how many of each type of parallel and insert were created for the set. This will give you a good idea how rare a set is and how quickly you need to snap up that card for your rainbow! I’ll also compare some of this info to the previous sets for reference. As a reminder, in addition to using the sell sheet and odds, we will also have to make some assumptions and flat out guesses when trying to figure some of these out.
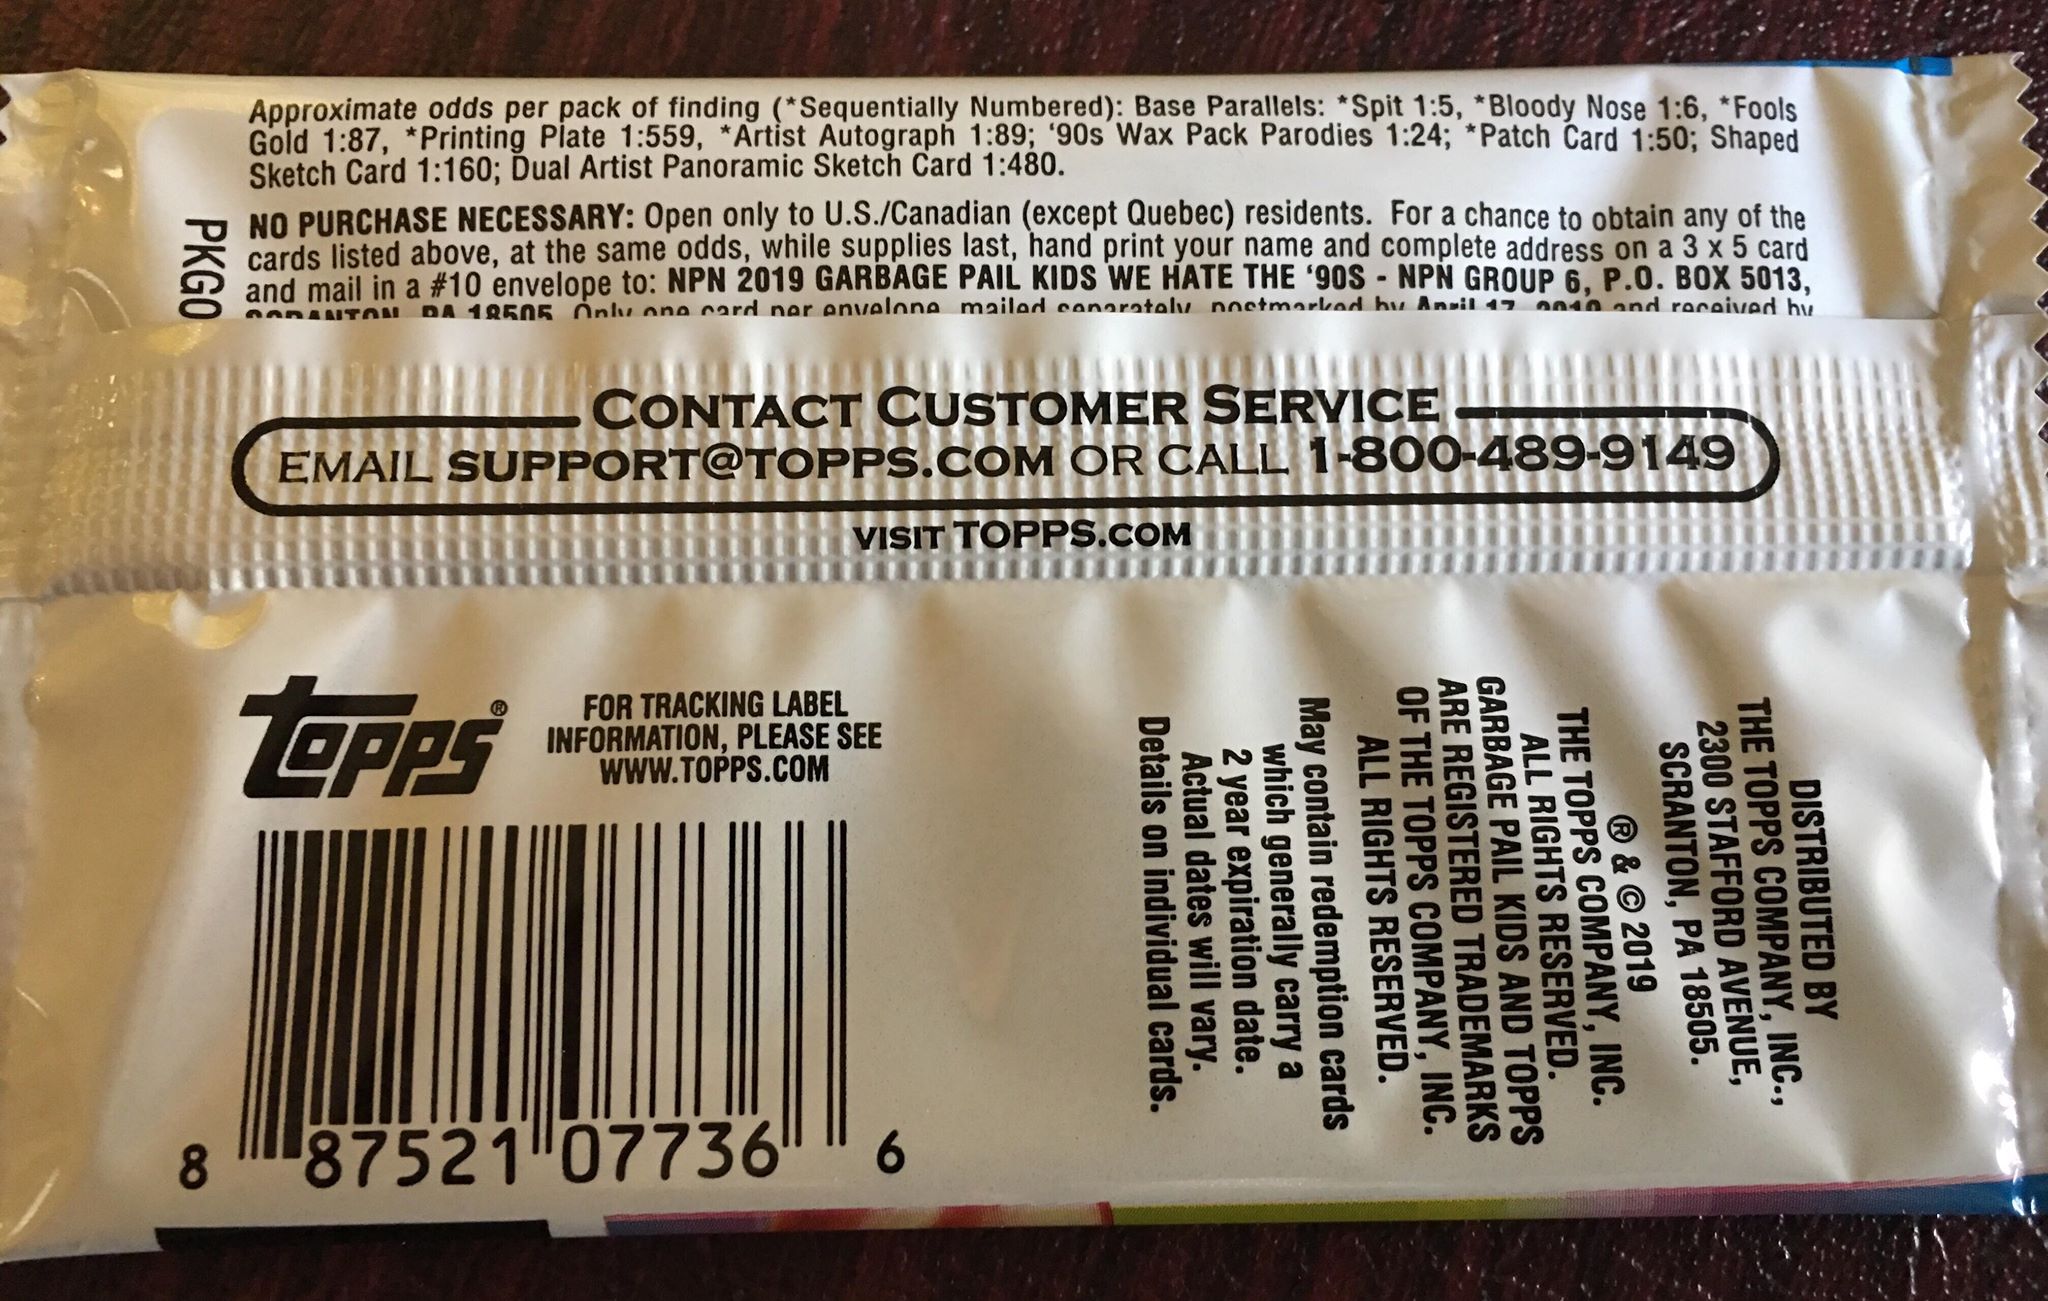
So how many of each type of card was made? We can’t figure it out for every type of insert or parallel. Some card types we don’t have enough information. Other times however, Topps is nice enough to tell us exactly how many of a card was produced. Like previous sets, Topps has continued to number many card types. This means we already know most of the parallel and insert numbers already! Makes this post a lot easier! We know Spit /99, Bloody /75, and Fool’s Gold /50 for the parallels, and Patches /50 and Autos /25 for the insert sets!
For previous sets there were always some card types we couldn’t determine production on. In the past we’ve never been able to break down the production of various retail pack types. However, with this series we did this in Part 1. We took the information from artists and the odds to come up with retail pack production. The numbers look close, and pass the logic test. Therefore, for the first time I’m going to take a crack at figuring out Yellow Phlegm, Purple Jelly, and the various retail insert set’s print runs.
First let’s figure out production for the various parallels.
- Bruised Borders – 50,000 Collector packs / 1 Odds (doh) = 50,000 total Bruised borders / 220 cards in set = 227 per card.
- Puke Borders – 423,000 Retail packs / 1 Odds (doh) = 423,000 total Puke borders / 220 cards in set = 1922 per card.
- Jelly Borders – 110,000 Fat Packs / 1 Odds (doh) = 110,000 total Jelly borders / 220 cards in set = 500 per card
- Phlegm Borders – 43,000 Retail’s Display packs / 4 Odds = 10,750 total Phlegm borders / 220 cards in set = 49 per card
 A lot of interesting information here. I believe these numbers help show our retail pack production numbers make sense. For this set, it looks like yellow borders are right around 50 per card. This puts them at the same rareness as the Gold borders. Is this the case for previous sets? No way! Because the yellow parallels only appear in Retail Display packs this time, there are the fewest available of any set to date. So how many yellow borders were in the previous sets? Using our production numbers for this set as a guide, I’m willing to estimate previous sets had a 150-200 per yellow border print run. Jelly borders at 500 per card also make a lot of sense. You’ll notice Bruised set production is down quite a bit from the Oh the Horror-ible set. This is because production was both smaller for Collector boxes, and Topps increased the set size. Puke borders come in right around the same because the increased retail production makes up for the increased set size.
Now let’s take a look at the various insert sets.
- Wax Pack Parodies – 50,000 Collector packs / 24 odds = 2,083 total Wax Parodies / 10 cards in set = 208 per card
- Wacky Pails – 110,000 Fat packs * 2 per pack = 220,000 total Wacky Pails / 20 cards in set = 11,000 per card
- Bathroom Buddies – 32,000 Blaster Boxes * 3 per box = 96,000 total Bathroom Buddies / 8 cards in set = 12,000 per card
- Classic 90’s – 43,000 Retail Display packs / 3 odds = 14,333 total Classic 90’s / 20 cards in set = 716 per card
Again this is the first time we’ve been able to try to figure out the print run of the various retail inserts. Classic 90’s are a small fraction of both the Wacky Pails and Bathroom Buddies based completely on pack type production. The Collector only Wax Pack Parodies are down quite a bit compared to the previous set due to lower Collector production.
One thing I like taking a look at each set is where all the printing plates are hiding. Historically, retail has the majority of the printing plates because it accounts for over 80% of the print run. One other thing these numbers will tell us is how close we are to having correct retail pack production numbers. We know Topps inserted 440 plates into production. Here is the breakdown of how many can be found in each pack type.
- Collector Plates – 50,000 packs / 559 odds = 89 plates in Collector packs
- Fat Pack Plates – 110,000 packs / 402 odds = 273 plates in Fat Pack packs
- Blaster Plates – 160,000 packs / 1208 odds = 132 plates in Blaster packs
- Retail Display Plates – 43,000 packs / 1221 odds = 35 plates in Retail Display packs
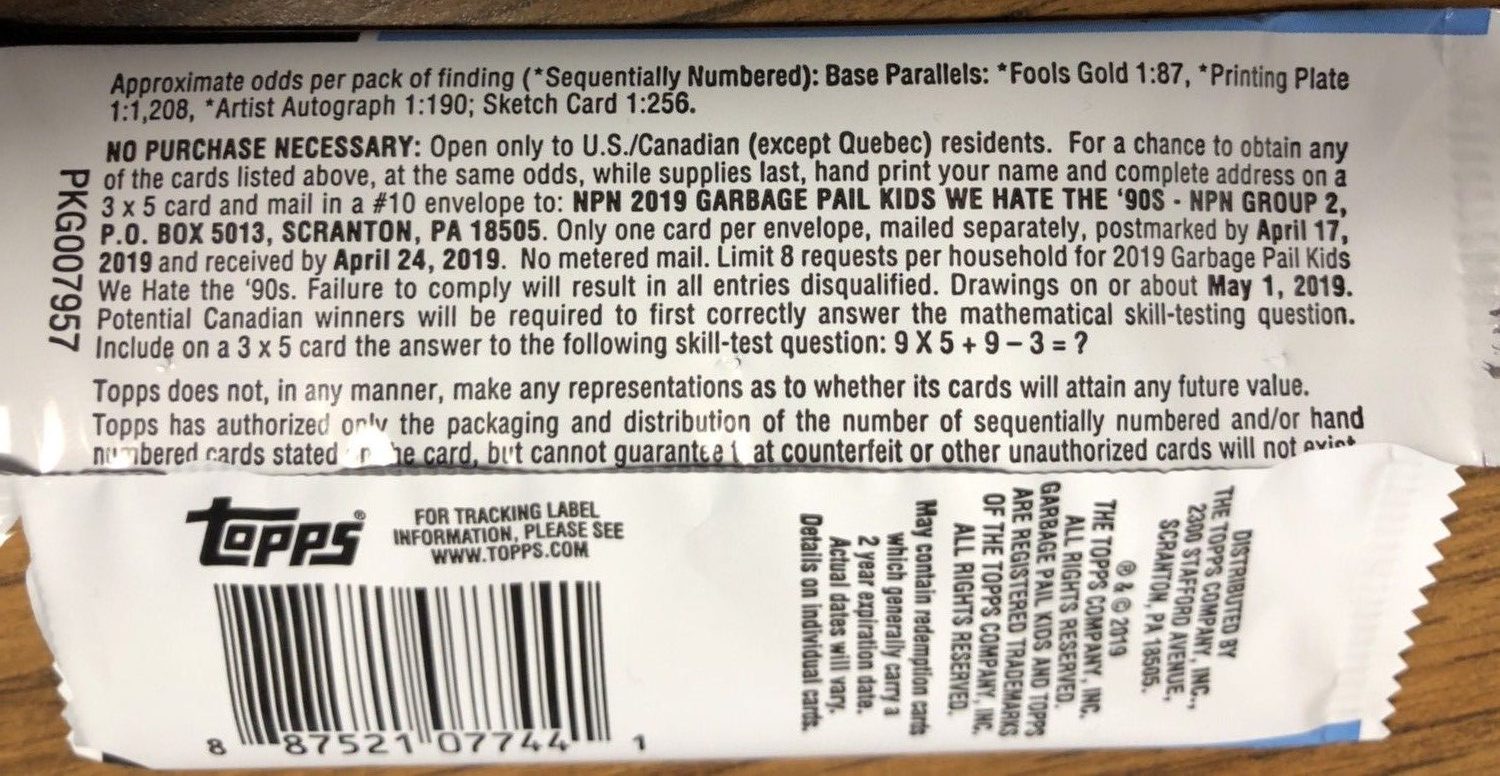 Right away you’ll notice the number of plates available in Collector packs is down sharply compared to the previous release. Topps raised the odds considerable on the newest set for plates. Secondly, if you add up all the plate numbers you get 529 total plates. We know that number is high. However, its in the ballpark. Which once again shows we are on the right track with our retail production numbers. Sure they are off a little bit, but considering Topps printed the incorrect odds for parallels on the packs, who’s to say the printing plate odds are correct as well. If you are plate hunting this set, Fat Packs look to be your best bet!
Topps is currently in a transition with their GPK brand. Without gravity feed boxes, Topps continues to try to find the right combination of retail pack production and insertion rates that work for retailers and collectors. Production was up this time around, due completely to higher retail orders. In fact this is the highest produced GPK set since Adam-Geddon. Can Topps keep this momentum as we head into later parts of 2019? Will collector apathy towards the new set cause lower production numbers for the 2019S2 set? Or will the theme and possible changes to the next set result in renewed collector interest? These will be things to keep your eyes on for the rest of 2019.
Finally, can we figure out how many base cards were produced? Not really, but we can use what we know and give it our best guess! We know Collector packs have 6 base cards per pack now, except for packs containing patches, but that number is so small we will go with 6. Retail/Hobby packs 7 base cards per pack this time around, except for packs containing gold dust, autos, sketches, and plates, but again that number is so small I’m going to go with 7 per pack.
Base Cards – (50,000 Collector packs X 6 cards per pack) + (423,000 Retail/Hobby packs X 7 cards per pack) = 3,261,000 Total Base Cards produced / 220 cards per set = 14,822 Total of each base card.
Once again the increase in set size has caused a slight dip in the total number of available base sets. Don’t delay you only have 14,000 chances to relive the 90’s!
This is Part 2 of a two part series on the production of 2019S1 GPK We Hate the 90’s. If you missed Part 1 you can go here to catch up.