
This is Part 1 of a 2 part series on the production of 2021 Series 1 Garbage Pail Kids Food Fight. Part 2 will be posting soon.
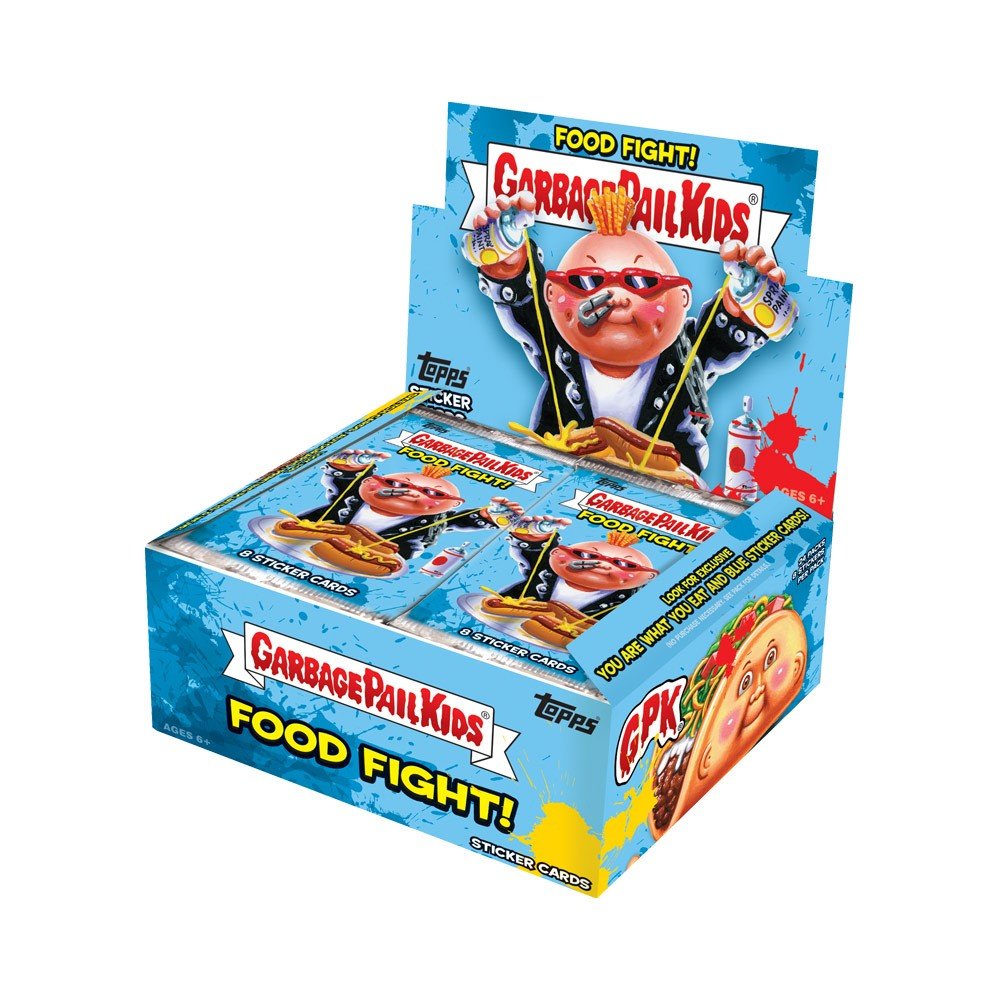 The last four months have been a whirlwind for Garbage Pail Kids collectors. Popularity of card collectibles, including GPKs, have been at sights unseen in years. Four months ago the 35th anniversary set became the highest produced GPK set in 10 years. Six weeks later the return of Chrome OS 3 blew through those records. There was some doubt if a themed, non anniversary, non chrome set could see similar interest. Collectors can put that doubt aside, as 2021 Series 1 Garbage Pail Kids Food Fight has once again broken all recent production records. Production is not only up, but up significantly over the 35th anniversary set. How high was the production? Read on to find out!
First my disclaimer! Production numbers are never an exact science, and Topps makes it tough on us. In order to attempt to solve this riddle we need to look very closely at the clues in both the odds and the sell sheets. Some things to keep in mind for this post. 1) Topps doesn’t want the public to know exactly how much of each card was made. Why? No idea really, I think its dumb, but historically Topps only provides enough information to get close. 2) We need to make some assumptions. Those assumptions will be based on the clues we have, but still some guessing has to happen. 3) The odds never quite seem to come out completely equal. However, we can round and get pretty close to how much was produced. 4) Topps changes what is printed from what the sell sheet says all the time. This will throw off all our numbers. 5) Keep in mind Topps historically holds back up to 5% of the print run to cover missing hits, damaged cards, and their No Purchase Necessary program. These numbers would include that 5%. With all that in mind let’s get started…(Warning lots of math coming up. If you don’t want to read about the process, skip to the bottom for the answer sheet!)
 To begin we need to figure out how many packs were made for the entire print run. We need to use a card type that has the same odds across all various pack types and where we know the number made. Once again this is true of the Gold parallels. First, a couple of notes. As a Topps tradition, they have once again overstated the parallels by double. Every release like clockwork. How do we know? Greens and Purples are listed in packs as 1:2, but are 1 per pack. Yellows listed 1:10, but actually fall 1:5. This is seen over and over with all parallel types. The other thing that has remained consistent on the odds is Fat Pack odds are once again 1/3 of a regular pack. We will count a Fat Pack as 3 retail packs to determine production. Keep that in mind as we are taking about the calculations.
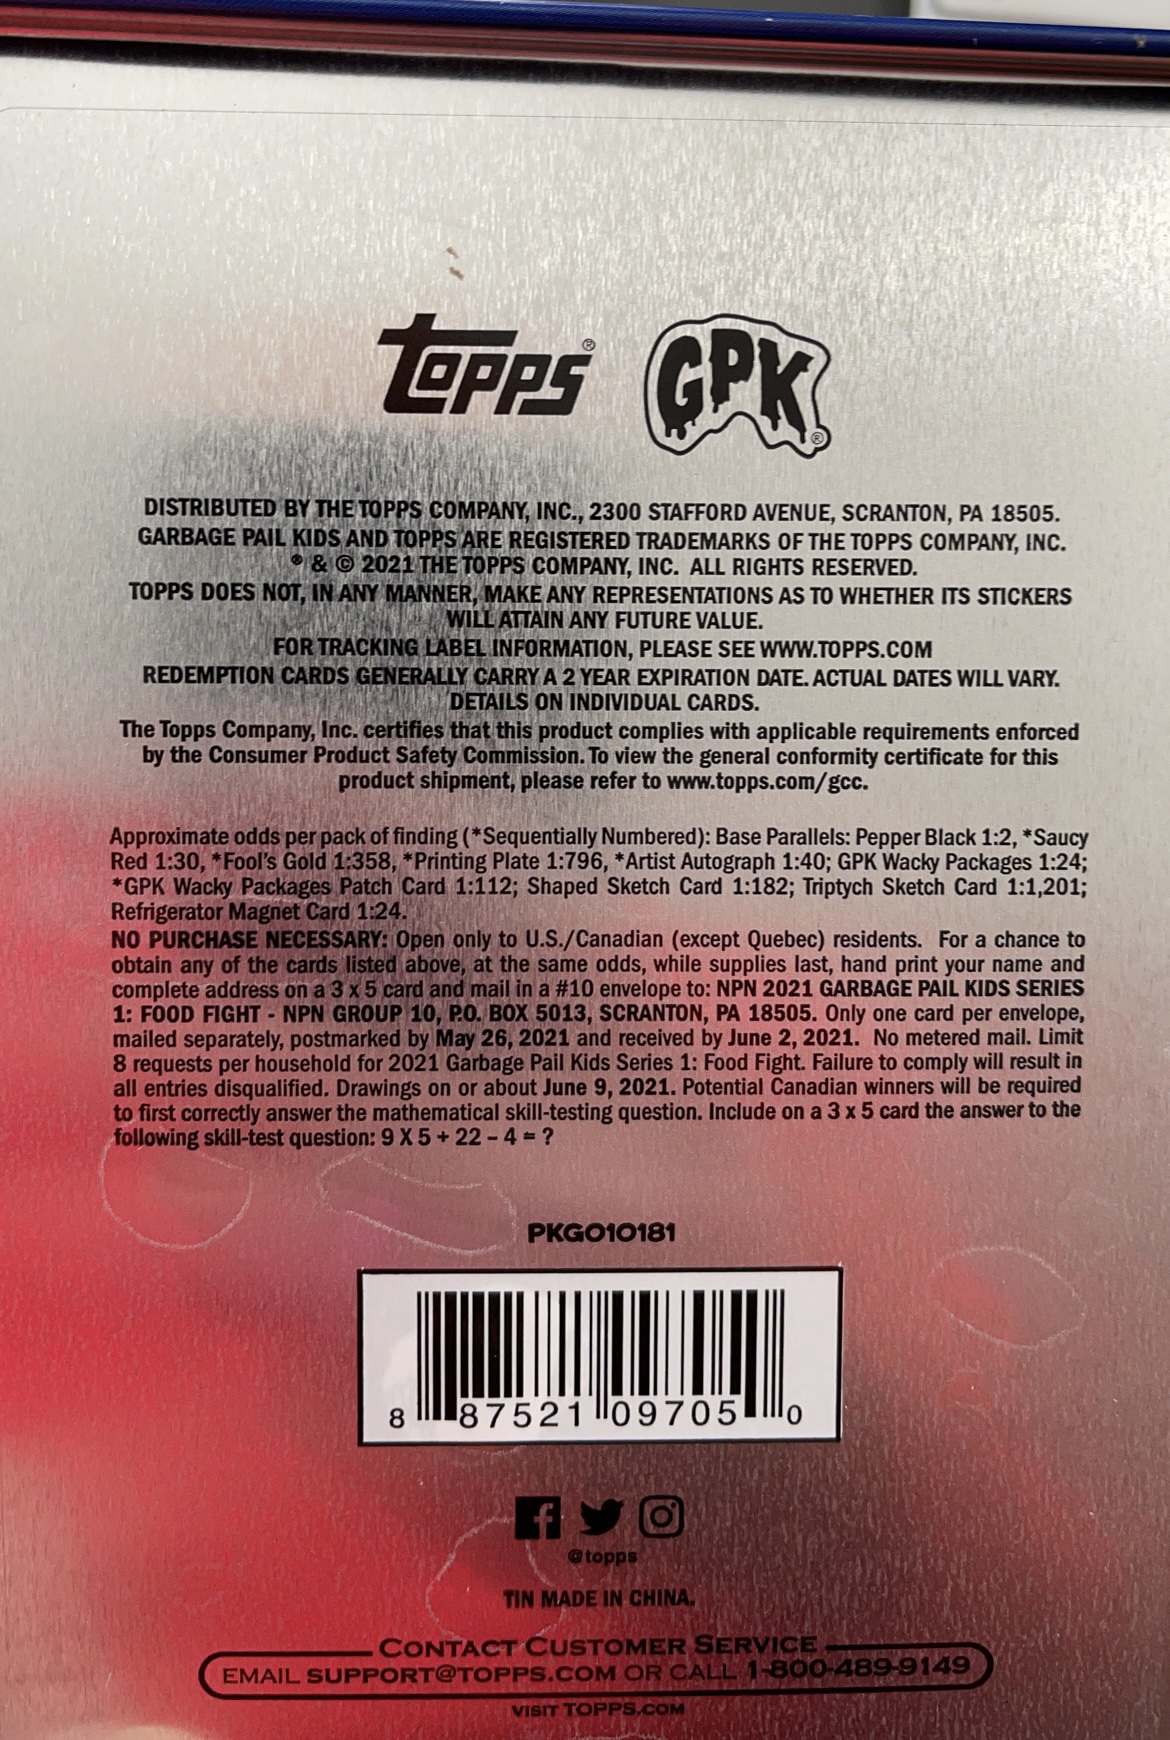
Gold parallels are listed at 1:358 in Collector, Retail, and Blaster packs. Fat Packs are 1:120. Since the odds are overstated by double, I’ll be using 1:179 as the actual gold odds. There are 200 base cards in the set. This release the Golds are /50 on the back. Therefore, 200 * 50 number of golds per card = 10,000 total gold parallels * 179 odds = 1,790,000 total packs made for this release. OMG! This blows away the 35th Anniversary set, blows away Chrome OS 3. It’s nearly 300% over the set release just 1 year ago, Late to School! It’s hard to wrap your head around the production increases seen in GPKs in just one year’s time.
Now that we know total pack production, let’s try to break it down by pack type. Collector packs are easy to figure out because they have a couple of different numbered parallels or inserts exclusive to the pack. Let’s look at red parallels and patches.
- Patch Cards – 10 cards in set X 199 made per card = 1,900 total patches x 112 odds = 222,880 Collector packs made
- Saucy Red borders – 200 cards in set X 75 made per card = 15,000 total Red borders X 15 odds = 225,000 Collector packs made
 Both of these numbers are very close, and gives us a great idea how many Collector boxes were made. I’m going to use 225,000 as the pack number for Collector packs. Right here we can see where part of the significant production increases start. Almost 100,000 more collector packs than the 35th set, and again an almost 300% increase over Late to School. Why the huge increase? I don’t think it’s solely due to content. Topps didn’t advertise the set much prior to release. Since the release of Chrome OS 3, and the online on GPK Sapphire, the hobby has seen a large increase of collectors from outside brands such as sports cards. Many saw profits possible on the secondary market and jumped in on the next retail GPK release.
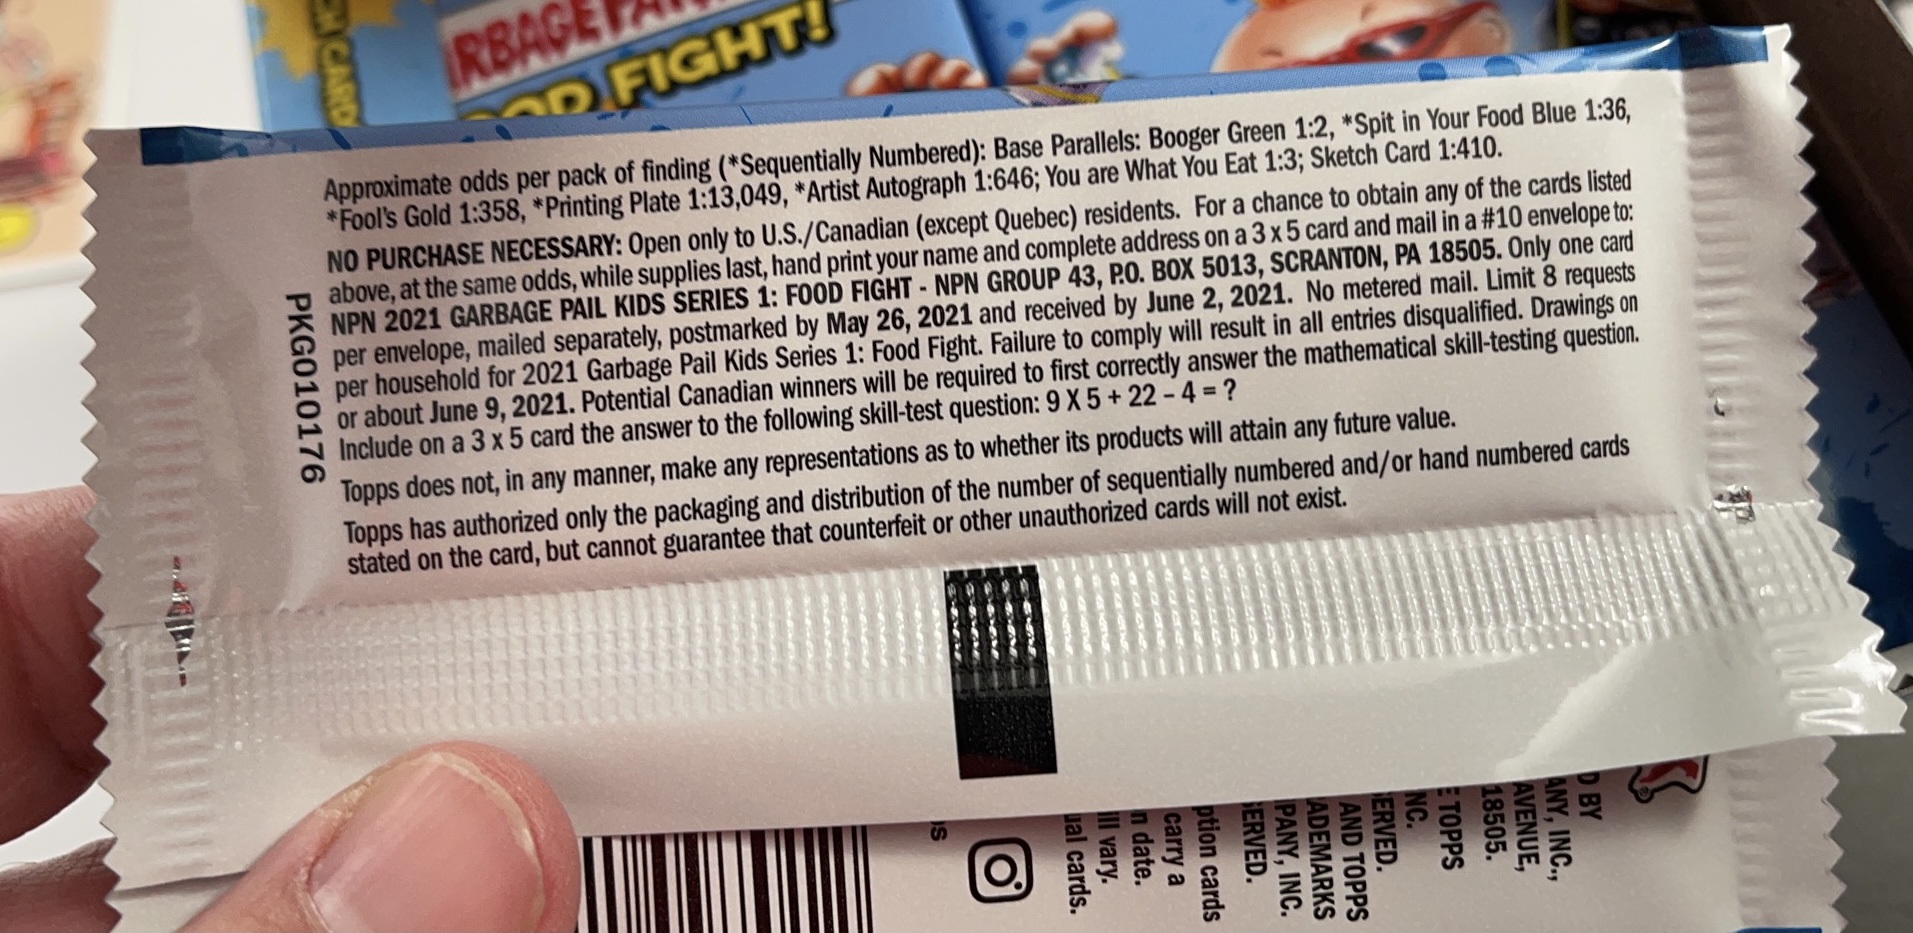
How about the other pack types? We need a card type from each pack type that is exclusive to that pack to break out the numbers. Once again for the second set in a row, Topps put the Blue parallels in Retail Display boxes. We already know Blue parallels are /99.
- Spit Blue borders – 200 cards in set X 99 made per card = 19,800 total Blue borders X 18 odds = 356,400 Retail Display packs made
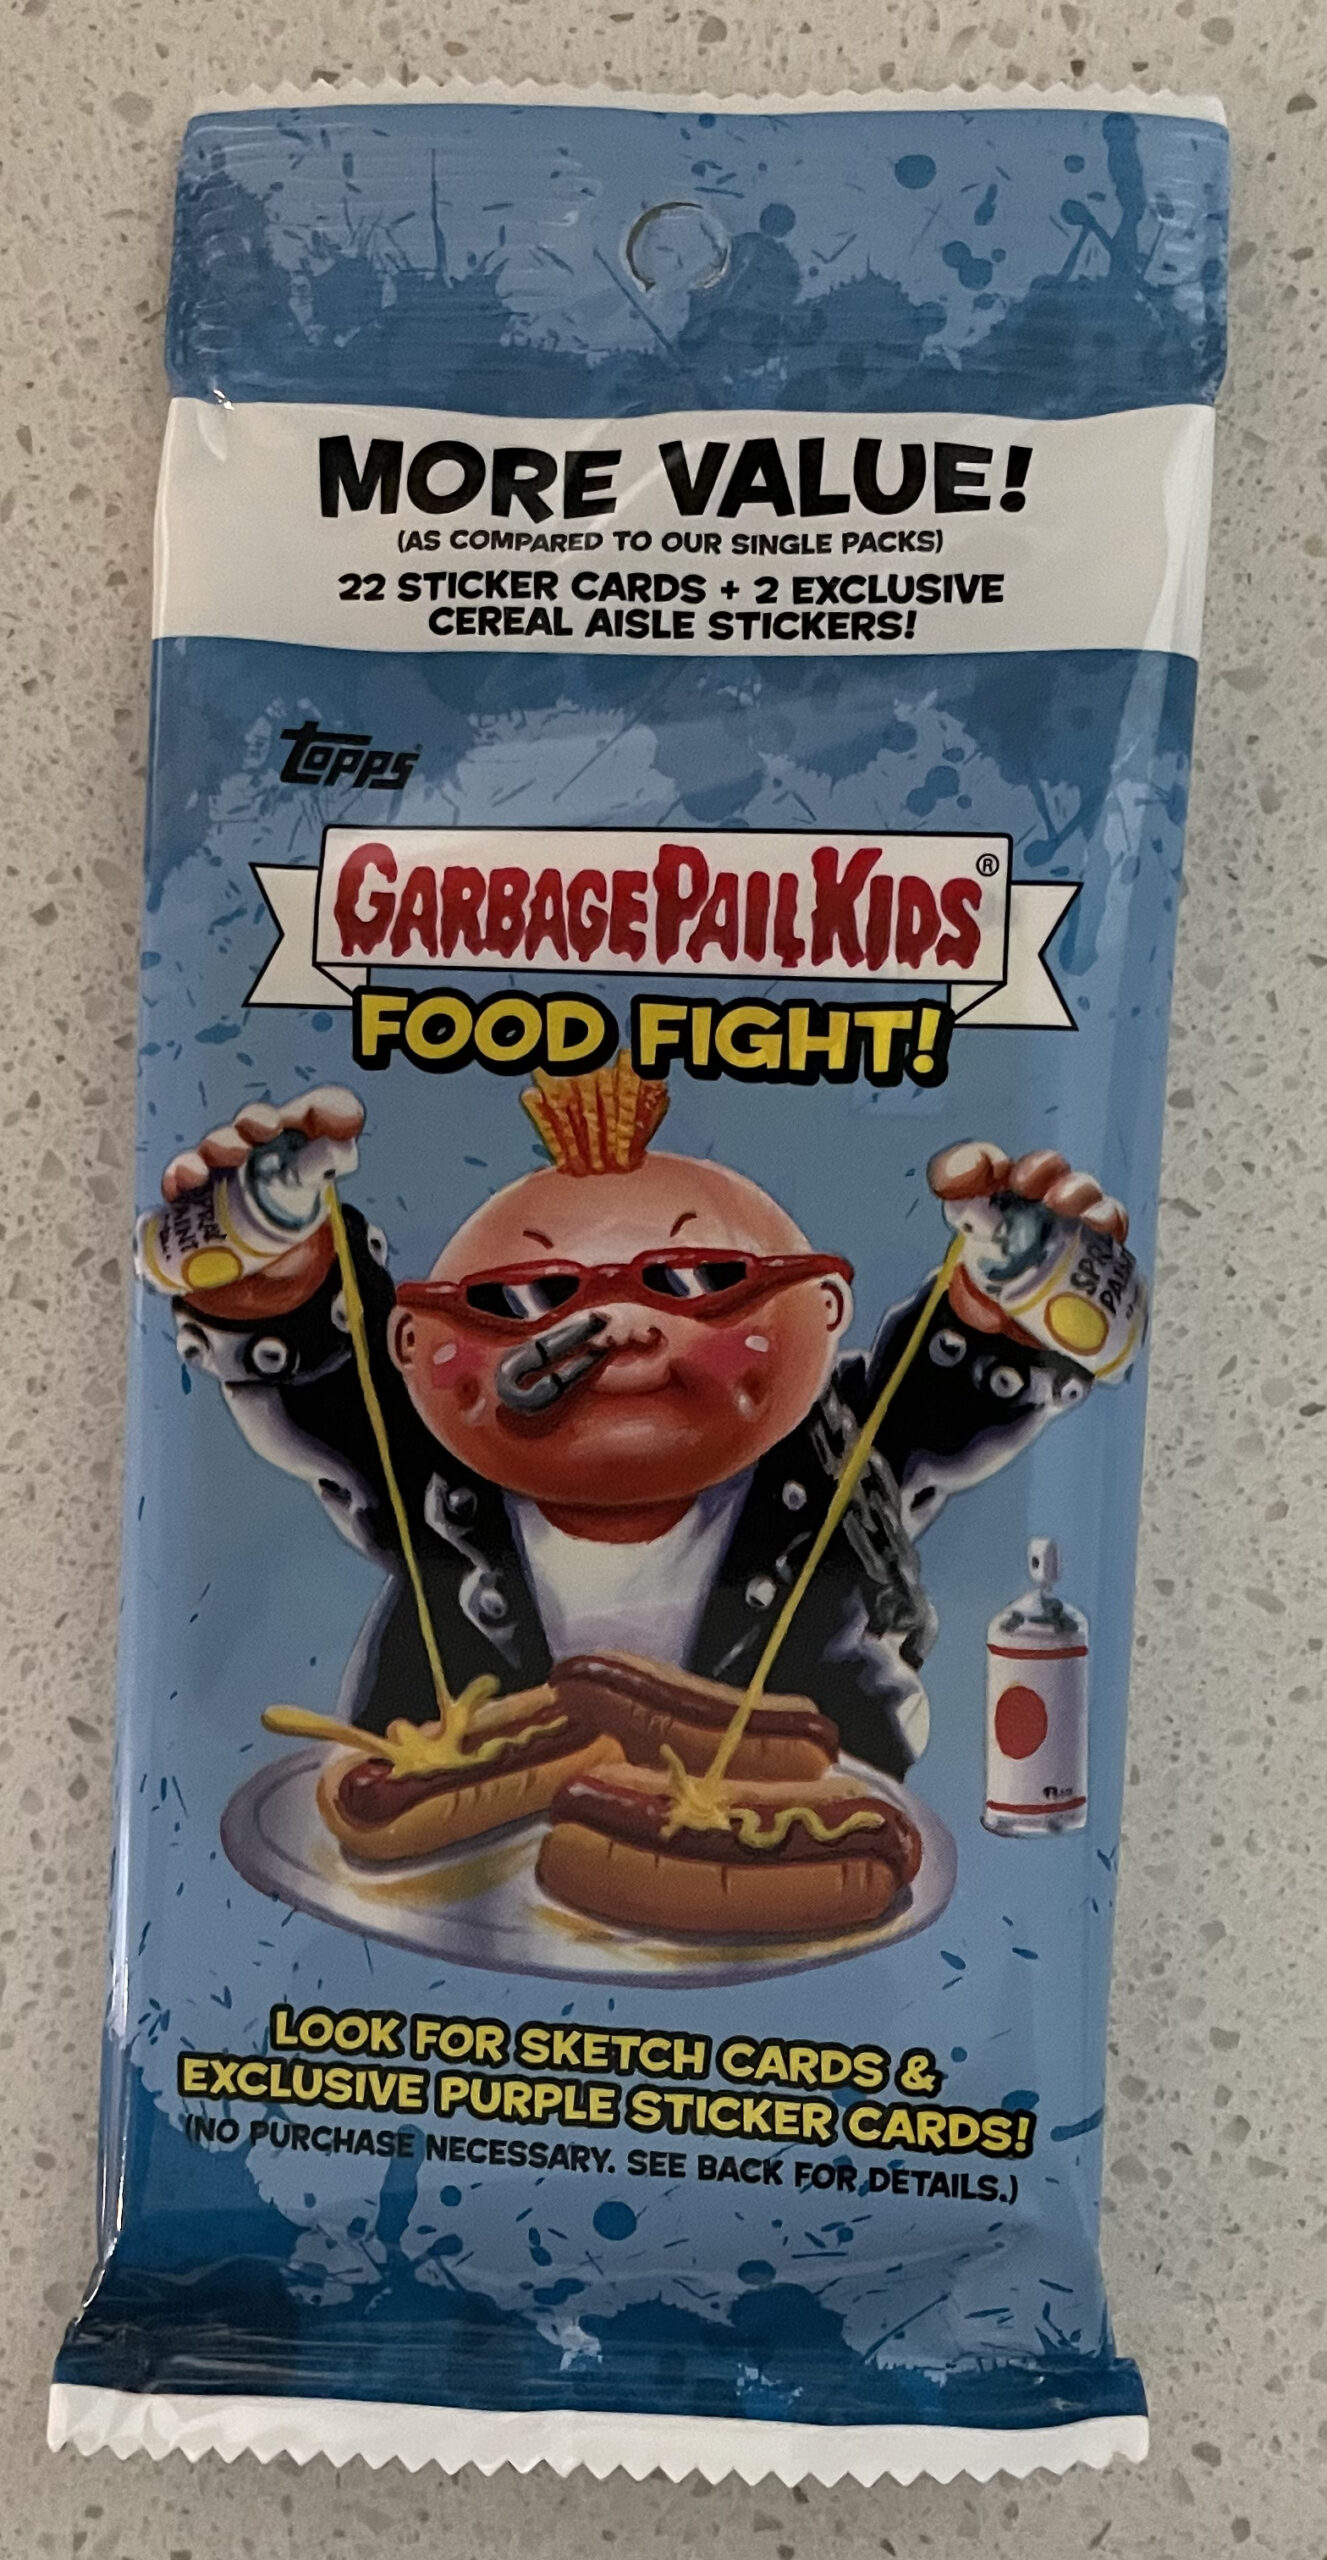
Again we can see more increases, and while not as high of a percent increase as Collector packs, still significant. Now how about Blaster and Fat Packs. Unfortunately, this is where we run into our first problem. Usually, we can use the odds for Loaded Puzzle and Panoramic sketches to figure out the production of Blaster packs. For an unknown reason, Topps did not include the odds for the Loaded Sketches on the Blaster Fridge Tins. GPKNews has reached out to Topps to try to get the odds, however with the recent change in Brand Managers information is hard to get. We are left with Panoramic sketch odds. The odds listed for Pano sketches are clearly incorrect on the packs. We know there were 60 artists complete sketches, each artist as asked to do 4 pano sketches. There should be 240 total pano sketches. If you multiple that by the odds 1:9897, you get over 2.3 million packs. This number is so out of whack when compared to the other numbers, I can’t begin to envision how Topps came up with it. Even if the odds were doubled on sketches, it would still be too many packs to make sense. I don’t know how to explain the pano odds, other than to say I’ve seen on previous releases the odds for one of the sketch types will be wildly incorrect. It’s unexplainable and Topps is not in the practice of explaining their methodology to others. So where does that leave us? Well, unable to break out the Blaster and Fat Pack numbers from the total Retail Pack production. That will also make it unable to figure out how many of the inserts and parallels exclusive to those packs were produced.
 So what do we know? We know there are a total of 225,000 Collector packs. Total packs are 1,790,000 – 225,000 Collector packs = 1,565,000 total retail packs. Then 1,564,000 retail packs – 356,000 Retail Display packs = 1,209,000 Blaster & Fat Packs. Again we can’t go further with more information. Also keep in mind the Fat Pack number would be 1/3, since we are counting each Fat Pack pack as 3 packs. I do think it makes sense to assume that once again Blaster packs out number Fat Packs 2:1 like the previous release.
What do the numbers tell us? That Garbage Paul Kids have exploded in popularity over the last year. It’s shocking to see how much is being produced and purchased by old and new collectors alike.
Here’s what I believe the total production numbers to be for Food Fight:
- Total Production – 1,790,000 Packs
- Collector – 225,000 Collector Packs or about 9,375 Collector Boxes or about 1.171 Collector Cases
- Retail Display – 356,000 Retail Display Packs or about 14,833 RD Boxes or about 1,854 RD Cases
- Blaster – Unable to determine
- Fat Packs – Unable to determine
I know this sounds like a broken record, but production is up, way up. This is the third straight retail release by Topps that has seen record numbers. Numbers are so much higher than anything released from 2016-2020S1. Take a look at how production compares to recent sets.
- Total Pack Production
- Revenge of Oh the Horror-ible – 748,000
- Late to School – 670,000
- 35th Anniversary – 1,113,000
- Food Fight – 1,790,000 (61% increase in production vs. 35th)
- Collector Pack Production
- Revenge of Oh the Horror-ible – 69,000
- Late to School – 74,000
- 35th Anniversary – 130,000
- Food Fight – 225,000 (73% increase in production vs. 35th)
- Retail Pack Production
- Revenge of Oh the Horror-ible – 679,000
- Late to School – 596,000
- 35th Anniversary – 983,000
- Food Fight – 1,565,000 (59% increase in production vs. 35th)
After figuring out the numbers on sets for the last five plus years, I continue to be amazed almost every release. Collectors will find longer odds than ever for “hits”. Odds are so long in retail products it will take multiple cases to just see a single hit in some cases. Topps however, has to be thrilled with the demand. Demand for GPK, a Topps owned brand, is a license to print money for Topps. How will this play out the rest of 2021? There are a lot of licensed products set throughout the year. There will certainly be a number of online offerings. Collectors will have to wait until late fall for 2021S2 and more Chrome. There will be another four month window at the end of 2021-2022 where collectors will have the chance at multiple retail releases. Will we continue to see huge production increases?
This is Part 1 of a 2 part series on the production of 2021 Series 1 Garbage Pail Kids Food Fight. In Part 2 we will look at production numbers for all parallel and insert sets. Part 2 will be posted soon.