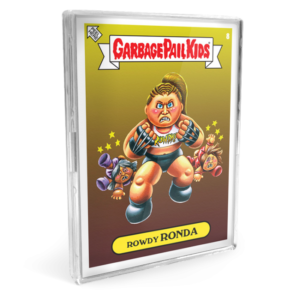
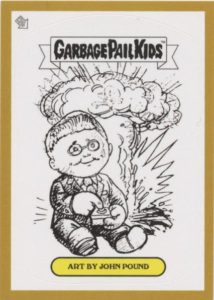
 Update 5/22/19 – Today marks the last week in the HobbyDB/GeePeeKay promotion. Week 6 brings us the Gold Border parallel. The card is limited to and numbered on the back out of /50. In order to purchase this week’s card you must add five new pictures to the HobbyDB database. Full details are available on their blog. After completing the task the cards can be purchased for $14.99 with free shipping. While copies of the other 5 cards are still available this one will sell out if it already hasn’t.
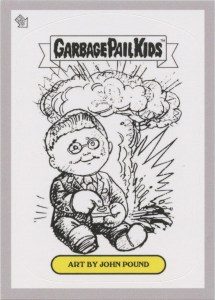 Update 5/15/19 – Only two weeks are left in the HobbyDB & GeePeeKay promotion. Week 5 brings us the silver bordered parallel. This week’s card is numbered on the back out of /100. In order to purchase this week’s card you must watch watch two instructional videos about HobbyDB and take a test afterwards. If you don’t get the questions right, HobbyDB will email you to retake the test. Once you pass your order will be shipped. Details are available on their blog. The card can be purchased for $12.99, shipping is free. While copies of the four previous cards are still available, there is a chance this one sells out, so get those test taking skills ready!
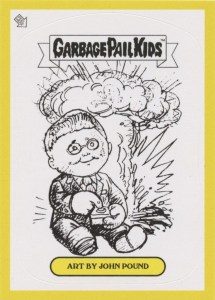 Update 5/8/19 – Week 4 of the HobbyDB & GeePeeKay promotion is upon us. This week’s Art by John Pound promo is the Phlegm parallel. The yellow bordered card is numbered out of /200. This week HobbyDB is giving collectors a break with the tasks. No task is required to purchase this week’s card. However, you must have completed the first three tasks. The card is available for $10.99 with free shipping. All the details are available on their blog. Collectors who missed out on previous weeks cards can still buy them as they are all available.
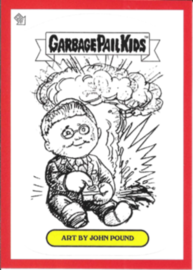 Update 5/1/19 – It’s Wednesday and that means another licensed promo card from HobbyDB and GeePeeKay. Promo #3 is the Bloody Nose parallel. This bright red bordered card is numbered out of /300 on the back. In order to purchase this week’s card, collectors must add 25 items from their database to their HobbyDB collection. Once that is done you can purchase the card for $9.99, shipping is free. Complete details can be found on their blog. Cards from the first two weeks are still available to collectors.
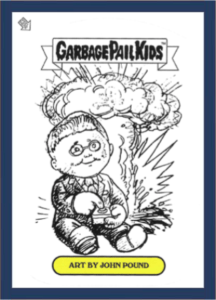 Update 4/24/19 – Week 2 is here and HobbyDB along with GeePeeKay have launched card #2. This week’s card is a Bruised parallel. This dark blue bordered card is numbered out of 400 on the back. In order to be eligible to purchase this week card, collectors must add 10 items to their wishlist on their HobbyDB account. Complete details can be found at their blog. Once the task is complete the card can be purchased fro $8.99, shipping is free. Collector’s who didn’t get last week’s card still have a chance as the website shows there is still some available.
Original article…
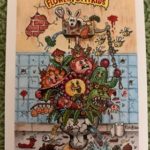
 HobbyDB and GeePeeKay today announced they have launched an exclusive Art by John Pound sticker card collection. The first card is available for sale today at HobbyDB’s website. The officially licensed Topps card features the Adam Bomb concept artwork by John Pound. The company is planning on launching one card per week over the next six weeks. The first card is called the White Border Variant and is limited to 1000 copies. Every Wednesday through May 22 a new card will be made available for purchase. Each week the print runs get smaller, with the last card only having a print run of 50. While the first card won’t be numbered, the remaining cards will all be limited and numbered on the backs.
In order to obtain each weekly card, collectors must first complete a task on the HobbyDB website. The first task is simple enough, signup and register on the HobbyDB website. After signing up, collectors can then purchase the first card through the website’s marketplace. The cards are limited to one per user, with the first card costing $7.99, with free shipping. The promotion is a way to get collectors familiar with the HobbyDB services they will be offering. HobbyDB is trying to create a number of databases for collectors of all types of collectibles to help manage their collections. GeePeeKay.com has partnered with HobbyDB to help create the database and launch this product. (Full disclosure, GPKNews has a working relationship with GeePeeKay, but is not involved in the launch of the product.)
This is the first officially licensed Topps product from HobbyDB. If you recall a few months back, the company asked for input on a possible high end licensed Adam Bomb statue they were working on developing. On Monday in a release on their website the company stated that plans for the statue were on hold. They said, “Although we would have loved to offer a statue, as originally planned, a cost explosion of Adam Bomb proportions would have run up the retail cost of the collectible to somewhere between $400 and $500. We haven’t given up on the idea, but we’re equally, if not more, excited to offer the opportunity to own a unique piece of Garbage Pail Kids’ nostalgia.” If the Art by John Pound sticker collection is successful the company has other ideas they want to explore with collectors.
Head on over to HobbyDB’s website to get all the details and links to signup and purchase the cards.
