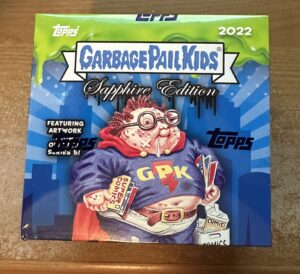
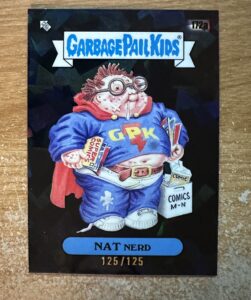
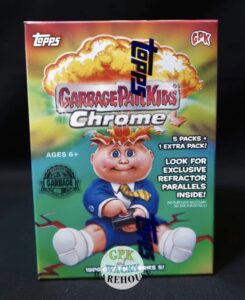
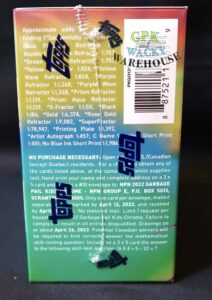
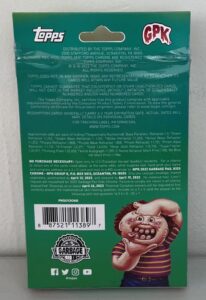
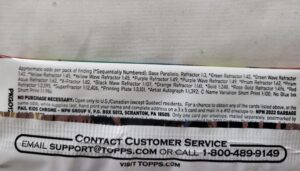
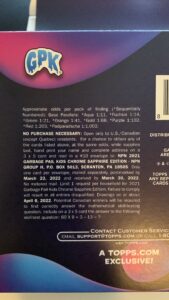
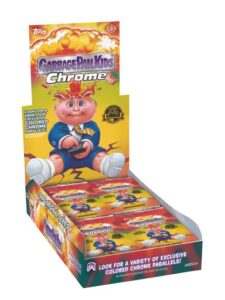
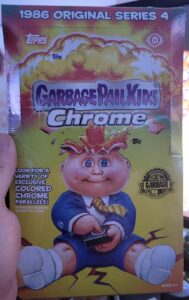
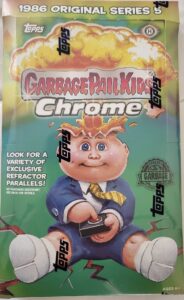
 Oh boy! Where should we start? Loyal readers who are familiar with my production articles will find this one to be quite different than usual. Why? Well with the release of 2022 Garbage Pail Kids Chrome OS 5, Topps has finally made it impossible to determine actual production numbers. How you ask? Well let’s start with nearly all the odds printed on all packs types are incorrect. And not just a little off, like usual. No, I think Topps may have just picked numbers out of a hat for the pack odds. Topps also debuted a new box/pack type with the Hanger retail boxes. The lack of exclusive parallels in Hangers also throws a wrench into the equation. So is there a way to determine how much Topps printed of Chrome 5? I think we can get a number that’s at least in the ballpark. Poor yourself a beverage, sit back, and follow along as I try to solve this puzzle.
First my disclaimer! Production numbers are never an exact science, especially with this set. In order to attempt to solve this riddle we need to look very closely printed pack odds, Chrome 4 odds, and multiple real life case breaks. Some things to keep in mind for this post. We are going to make a lot of assumptions in this article. They will be based on past and current evidence, but the only way we will get to an answer here is to use what we know and project that out. Remember, while we will talk about multiple real life case breaks, more than ever before, there are always outliers. Some cases will be worst than others, some will be better. In the end though, a pattern starts to emerge of an average case. Likewise, it’s tough to use small sample sizes. Someone might have a hot 6 boxes of something, that doesn’t mean all boxes are hot. Also, keep in mind Topps historically holds back up to 5% of the print run to cover missing hits, damaged cards, and their No Purchase Necessary program. These numbers would include that 5%. With that being said, let’s get started…
First thing we need to do is figure out is how many packs of each box type were produced. We can do that by using any exclusive parallels and the pack odds. Let’s take a look at Hobby boxes first. There are 3 exclusive parallels in Hobby boxes; Black Wave, Orange, and Red Refractors.
- Orange borders – 100 cards in set * 75 made per card = 7,500 total Orange borders * 141 odds = 1,057,500 total Hobby packs
- Black Wave – 100 cards in set * 99 made per card = 9900 total BW borders * 107 odds = 1,059,300 total Hobby packs
- Red borders – 100 cards in set * 5 made per card = 500 total Red borders * 2,095 odds = 1.047,500 total Hobby packs
 All those numbers are pretty darn close, that’s good. However, let’s compare the C5 Hobby odds to the C4 hobby odds. C5’s printed odds are really close to C4 across the board, almost for everything. So, one would logically think there should be the same number of “hits” in C5 that were in C4. This is where Topps makes their first huge error. The printed odds say a case should yield on average 60 hits per case. However, when you look at actual Hobby case breaks from collectors, they are only pulling a little less than 1/2 the expected hits from Hobby boxes. GPKNews has been in contact with many large and small case breakers the last week+. Hobby case results have been reported from 24-30 hits per case. Somewhere in the middle of that seems to be the norm. As you might expect, collectors have been bitterly disappointed with Hobby boxes. It’s bad enough most boxes yield only 2 hits, but to add insult to injury Topps has completely screwed up the odds.
Where does that leave us? Not all odds are wrong on the Hobby pack. The odds, strangely, for non-numbered hits like regular Refractors and C Cards, seem to be accurate. More importantly, it also seems exclusive parallel odds appear to be either right, or really close. Collectors should get 2.6 Black Waves and 2 Oranges per case. Cases have pulled anywhere between 0-3 of each of these it seems, usually 2-3 each. We should trust what we see here, it appears there are a similar number of Hobby packs produced for C5 vs. C4. I’m going to use 1,050,000, a nice round number somewhere in the middle of the exclusive parallel calculations. Wait, production similar? How can that be if boxes are only giving 1/2 the number of hits? If that’s the case, then where did all the non-exclusive hits go? Keep reading to find out!
Let’s tackle Blaster boxes next. Blasters were suppose to have 3 exclusives again. Sadly, Topps made a change, only Black and Atomic Refractors are exclusive to Blaster boxes in C5. Atomics aren’t numbered, so we can only look at Black Refractors to get a pack count.
- Black – 100 cards in set * 99 made per card = 9900 total BW borders * 186 odds = 1,841,400 total Hobby packs
Wow! That’s an amazing number of packs. Would be more than double of C4. Can it be right? Now let’s look at the printed odds. What kind of over inflated numbers are these?!? The printed odds on C5 Blaster packs are so far off it’s laughable. Based on the printed odds collectors should only expect 6 hits in a Blaster case, with 3 of those being C cards! Luckily for collectors, the printed odds are not correct. Real life case results have shown that C5 blasters are yielding about the same number of hits as C4 blasters. While there have been outlier cases in both directions reported, as low as 18 hits and as high as 30, it looks like the average Blaster case is yielding 24-25 hits. Somewhat surprisingly this is very similar to what C4 blaster cases had, maybe slightly more on average. Collectors busting blaster boxes will have a similar experience as they did to C4, and if you are talking pure value, when you consider Atomic Refractors, Blaster boxes are a better buy than Hobby boxes.
 So, what do the odds on Blasters tell us? Again, we have to focus on the exclusive Black Parallels. Based on the odds, collectors should expect to see 1.2 per case. Again, real life case results appear to prove that out. Cases have between 0-2 Black refractors reported for the most part. I think we have little choice here but to believe the Black Refractor odds, and go with 1,841,400 as the total Blaster pack count. As with Hobby odds, it appears the odds for the non-numbered cards are accurate. Regular Refractor, Atomic Refractor, and C Cards all appear to be falling at the appropriate rates. So how can we possibly explain the super inflated odds for most of the numbered parallels? Well we can’t, but I found something interesting when running numbers. If you compare the odds on C4 blasters to C5 blasters for Green (Wave), Yellow (Wave), Prism (Aqua), XFractor, and Rose Golds they are each 6.3x higher for C5 than C4. That’s interesting, and is going to come in useful for us coming up soon.
 We’ve gone over Hobby and Blaster pack numbers. I think by using the exclusive parallel odds we have a good ballpark pack count for each. Hangers are going to be another story completely, and this is where we are going to have to take a few leaps of faith. It would have been easy to figure out Hanger production if there was an exclusive parallel, however there are no exclusives in Hanger packs. To complicate things the odds on Hanger packs are just as laughable as with Blasters. Let’s see if we can use both what we know and what we assume to reverse engineer the Hanger production. We need to figure out how many of a known numbered parallel is in each pack type. We need to know both the pack protection and accurate odds for the parallels. We’ve already figured out the pack production for Hobby and Blaster packs, but what about accurate odds? We know we can’t use the odds printed on the packs. For example take the Green Refractors. Hobby odds are listed at 1:42, while Blaster odds at 1:757. Here’s our first leap of faith. We know from multiple reports Hobby cases are actually only yielding about 1/2 the hits they should be. So let’s double the printed odds, and use 1:84 for Hobby Green Refractors. Now for leap of faith #2. For Blasters we’ve seen from multiple case breaks that they are yielding just about the same number of hits as a C4 blaster. So, let’s get crazy and use the odds from C4 blasters. But Jeff, you’re saying, that’s gone too far! There’s one thing Topps is consistent at, even in their incorrect odds. Their odds are usually pretty symmetrical. The odds go up in a logical mathematical way based on each parallel’s serial number. C4 is this way, and even the astronomical C5 numbers are that way. Remember, when I mentioned earlier that odds for many parallels for C5 blasters are 6.3x higher than their C4 counter parts? That’s why I’m comfortable using the C4 Blaster odds on the C5 production numbers. We can use this method for Green, Yellow, Prism, and Xfractor.
- 100 cards in set * /299 = 29,900 total Greens in C5
- 1,050,000 Hobby packs / 84 odds = 12,500 Greens in Hobby
- 1,841,400 Blaster packs / 120 odds = 15,343 Greens in Blasters
- 29,900 total greens – 12,500 Hobby greens – 15,343 blaster greens = 2,057 Greens in Hangers
Some observations on these numbers. If you look at C4, Hobby packs had 22,800+ greens, while Blasters had 6,900+ greens. So this right here shows where Topps robbed Peter (Hobby) to pay Paul (Retail) in C5. We can see the movement of hits from one pack type to the other two. So now we have an idea how many Green Refractors are in Hangers, we need to know the odds to figure out production. But the printed odds are very wrong. We know this again, because multiple real life examples show Hanger cases are yielding 24-28 hits. Time for leap of faith #3. Topps again is consistent with their odds being symmetrical. We saw this with Blasters, and we see this with Hangers. If you compare the odds on Hangers to C5 Blasters for Green, Yellow, Prism, and Xfractors you’ll see that the C5 Blasters are 65% of the C5 Hanger odds. For each one! Yes the odds are really wrong on both, but they are all wrong at the same rate! Let’s use this to our advantage. If Topps intended the Blaster odds to be 65% of the Hanger odds, let’s use the odds we are using and a little algebra to figure out Hanger pack production.
- 120 Green Blaster Odds / x Hanger Green odds = .65
- Solve for x: x = 184 Hanger Green Odds 1:184
- x Hanger Packs / 184 Hanger Green odds = 2,057 Greens in Hangers
- Solve for x: x = 378,488 Hanger packs
You can use this same exercise on Yellows, Prisms, and Xfractors. I did, and I’ll save you the math explanation. Here are the pack production numbers on Hangers using each eligible parallel type.
- Green – 378,488 Hanger Packs
- Yellow – 334,000 Hanger Packs
- Prism – 332,028 Hanger Packs
- XFractor – 315,492 Hanger Packs
While somewhere in the mid 350k is a much smaller number that Hobby and Blaster, it’s still a large pack number. The numbers also confirm something I had heard from multiple distributors. Hanger cases were allocated, and most people could only order a limited amount. Blasters however had no allocation, and were free game. The production numbers we came up with show why. Let’s use the 334,000 number for our Hanger production number.
 Look if you’ve make it this far, you probably think this is nuts. But I think this puts us in the general ballpark for production. I spent hours trying to look at every possible angle, and I kept coming back to the things we know and keep seeing. Time and time again the real life case breaks proved the Black and Black Refractor odds looked to either be accurate, or pretty darn close. We also saw Hobby pulls were roughly 1/2 of what was expected, and Blaster cases were very similar to C4 Blaster cases. When you take those things into consideration, there are only so many places where all these finite hits can go.
Now that we have production numbers, let’s see how the C5 production compares to previous Chrome releases.
- Total Production
- Chrome OS 1 – 1,096,370
- Chrome OS 2 – 513,260
- Chrome OS 3 – 1,310,000
- Chrome OS 4 – 1,812,500
- Chrome OS 5 – 3,225,400
- Hobby Pack Production
- Chrome OS 1 – 407,000
- Chrome OS 2 – 71,500
- Chrome OS 3 – 560,000
- Chrome OS 4 – 982,500
- Chrome OS 5 – 1,050,000 or 43,750 boxes or 3,645 cases
- Retail Pack Production
- Chrome OS 1 – 689,370
- Chrome OS 2 – 441,760
- Chrome OS 3 – 750,000
- Chrome OS 4 – 830,000
- Chrome OS 5 – 2,175,400
- (C5 Blaster 1,841,400 Packs or 306,900 Boxes or 7,672 Cases)
- (C5 Hanger 334,000 Packs or 66,800 Boxes or 1,043 Cases)
Wow! What an increase in production! This is a 77% increase in production over C4. Needless to say this is the largest produced modern GPK set, going back as far as we can determine print runs with odds. What confuses me, is what would Topps have seen to increase production this much? C4 is still readily available at discount prices. There was no need to increase production. There will be C5 blasters on shelves and clearance bins for years. Distributors are going to have to heavily discount Hobby boxes to get them to sell.
Now that the hard part is over, we can get on to a discussion around the various parallels and inserts in the product. First a word about the numbered parallels I haven’t mentioned in this article so far. While we were able to use Green, Yellow, Prism, and Xfractor odds to help us in calculations, you might have wondered why I didn’t use Purple. For some reason on Blasters and Hangers the Purple odds are not symmetrical like the others are. It’s curious that Purples are the only ones listed in a completely different manner, I can’t explain it. Gold Refractors were moved from a C4 blaster exclusive to being in all pack types in C5. The Gold odds are wrong, but I have nothing to compared them to from C4. Finally, I spent more hours than I care to admit trying to use the odds for Superfractors, Autos, and Plates to determine production numbers. Quite often in previous sets the odds for these super rare cards don’t add up, and Topps will not distribute them at the same percentages of the other parallels. I suspect that’s the case here as the odds for all these are incorrect on all pack types.
That leaves us with the odds we do know are correct. It appears the odds for the non numbered parallels and inserts; Refractors, Atomics, C Cards, No Blue Ink(Maybe) are accurate. Let’s take a look how many of those we have.
- C Name Variation – 3,225,400 total packs / 100 odds = 32,254 total C cards / 50 cards in set = 645 each C Name Variation.
- Refractors – 3,225,400 total packs / 3 odds = 1,075,133 Total Refractors / 100 cards in set = 10,751 each regular Refractor
- Atomic Refractors – 1,841,400 total Blaster packs / 2 odds = 920,700 total Atomics / 100 cards in set = 9,207 each Atomic Refractor
- No Blue Ink Inseet – 3,225,400 total packs / 1986 odds = 1,624 total No Blue Ink / 50 cards in set = 32 each No Blue Ink Insert
As you would expect, the numbers for Refractors, Atomics, and C Cards have increased in line with production. There are some questions so far on the No Blue Ink Inserts. To date six total No Blue Ink inserts have surfaced in collector groups and eBay. The odds say we should see one every 8 cases or so. We should probably have seen more by now, but the sample size on these ultra rare inserts is small right now. There’s a good chance there are around 30 each of the No Blue Ink cards.
 After going through this exercise how confident am I in these numbers? Well, not nearly as confident as I usually am. We had to take a few leaps of faith and do some mathematical gymnastics, but I do believe we are in the ballpark here. I want to thank the numerous collectors who sent me their breakdowns of case breaks, and had discussions with me the last few days about production. It was all very helpful!
Where will Topps go from here? The increases in production of GPK certainly has a limit. Have we reached the limit yet? Chrome 5 is not going to dry up for quite some. Topps is going to see returns on product from retailers. (Trash boxes anyone?) This certainly seems like Chrome 1 all over again. There is a 2023 GPK Chrome set on Topps’ calendar. The question is, will the overproduction cause Topps to pump the breaks on GPK at all this year?
Finally, can we figure out how many base cards were produced? Not really, but we can use what we know and give it our best guess! I feel safe using 3.5 base cards per pack as a good number. We used this same number for C4, and I believe it applies here as well.
Base Cards – 3,225,400 total packs * 3.5 base cards per pack = 11,288,900 Total Base Cards produced / 100 cards per set = 112,889 Total of each base card.
GPK has crossed the 10 million base card line!!! I’m exhausted, time for a nap.

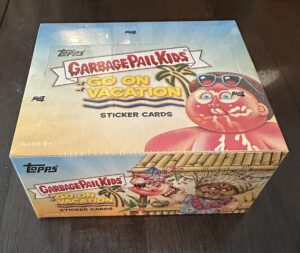
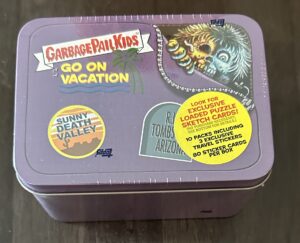
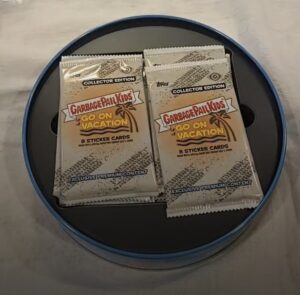 The official release date might not be until tomorrow, but we now know all the box odds for 2023 Series 1 (2021S2) Garbage Pail Kids GPK Goes on Vacation. Thanks to collector Jared Mccorkendale for sending along pictures of the Collector box odds. As with Retail odds, it appears Topps actually got the odds right for this release. Reds are listed at 1:12, and the early boxes have 2 per box. There is one luggage tag in each box. Based on the odds production is down for Collector boxes considerably from Book Worms, and slightly down from Food Fight. I’ll have more on production numbers in the coming days.
