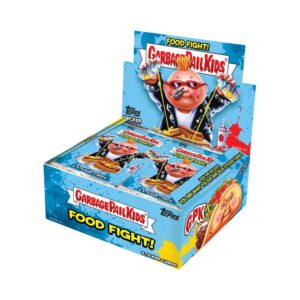
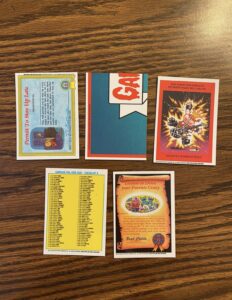
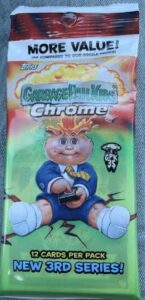
 It took six years for Topps to produce a new GPK Chrome set. They thought it wouldn’t sell. With collectibles at a higher popularity in a long time due to Covid-19, and this year being the 35th anniversary of GPKs, it was a perfect storm of events for Topps to give Chrome another try. Apparently selling it wasn’t a problem for them. Production, as you will see, is very high for this set, higher than Chrome OS 1, and the largest produced GPK product since odds started. Let’s dive in and see what the various numbers look like. Just how much Garbage Pail Kids Chrome OS 3 is out there…
First my disclaimer! Production numbers are never an exact science, and Topps makes it tough on us. In order to attempt to solve this riddle we need to look very closely at the clues in both the odds and the sell sheets. Some things to keep in mind for this post. 1) Topps doesn’t want the public to know exactly how much of each card was made. Why? No idea really, I think its dumb, but historically Topps only provides enough information to get close. 2) We need to make some assumptions. Those assumptions will be based on the clues we have, but still some guessing has to happen. 3) The odds never quite seem to come out completely equal. However, we can round and get pretty close to how much was produced. 4) Topps changes what is printed from what the sell sheet says all the time. This will throw off all our numbers. 5) Keep in mind Topps historically holds back up to 5% of the print run to cover missing hits, damaged cards, and their No Purchase Necessary program. These numbers would include that 5%. With all that in mind let’s get started…(Warning lots of math coming up. If you don’t want to read about the process, skip to the bottom for the answer sheet!)
Usually I do a two part production article for retail releases. This time everything is in one article. Most of the parallels are already numbered, and there aren’t really any inserts, so there isn’t as much to take a look at. However, there is still the big picture! First, we need to figure out how many packs were made for the entire print run. A note to collectors who are used to Topps printing incorrect odds on packs. For the most part, based on early breaks, the odds appears to be accurate. Second, usually to figure out total production run we need one card type with the same odds across all pack types. Well with Chrome OS 3, that doesn’t exist. So we will have to go in reverse to figure out production.
Hobby production is easy to figure out since there are two card types that are exclusive to Hobby, and we know the print run already, Gold and Black. Let’s take a look at those.
- Gold borders – 100 cards in set * 50 made per card = 5000 total Gold borders * 112 odds = 560,000 total Hobby packs
- Black borders – 100 cards in set * 99 made per card = 9900 total Black borders * 57 odds = 564,399 total Hobby packs
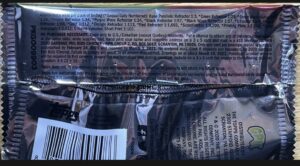 Two observations, 1) Those two numbers are very close, and 2) Holy smokes that’s a lot of hobby packs!!! Topps printed a lot of this set! The difference in the numbers can be attributed to rounding by Topps. I’m confident in going with 560,000 as the Hobby pack number. Now we need to figure out retail packs. There isn’t anything exclusive to retail packs that’s numbered. However, since we know the Hobby pack number we can try to figure out how many of a parallel is available just in Hobby packs. Let’s look at Superfractors.
- Superfractors 560,000 Hobby packs / 9,200 odds = 60 Supers in Hobby. 100 total Supers in set – 60 Supers in Hobby = 40 Supers in Retail.
We know there are 40 Supers inserted in all retail pack types. So let’s use the retail odds to figure out how many retail packs were made. First a note on Retail Fat Packs and odds. In order to figure out the odds we will assume Fat packs equal three Blaster packs. Why? Fat packs have 3 times the cards as a Blaster pack, and the odds are 1/3 for almost every parallel type. I’ll be using the Blaster odds for the retail calculations the rest of the article.
- Superfractors in Retail 40 * 22,077 = 883,080 Total Retail packs.
That’s a big number! Topps did print a lot of Hobby packs, so it stands to reason there’s a lot of Retail packs as well. How can we be sure? We can double check the numbers by using other parallels where the Fat pack odds are 1/3 of Blaster odds. In this case we can use Green, Purple, Orange, Red, and Autos. Let’s first figure out how many of each are in Hobby vs. Retail.
- Green Refractors 560,000 Hobby packs / 29 odds = 19,310 Greens in Hobby. 29,900 total Greens – 19,310 Greens in Hobby = 10,590 Greens in Retail * 71 odds in retail = 751,890 Total Retail packs.
- Purple Refractors 560,000 Hobby packs / 34 odds = 16,470 Purples in Hobby. 25,000 total Purples – 16,470 Purples in Hobby = 8,530 Purples in Retail * 85 odds in retail = 725,050 Total Retail packs.
- Orange Refractors 560,000 Hobby packs / 113 odds = 4,955 Oranges in Hobby. 7,500 total Oranges – 4,955 Oranges in Hobby = 2,545 Oranges in Retail * 282 odds in retail = 717,690 Total Retail packs.
- Red Refractors 560,000 Hobby packs / 1,693 odds = 330 Reds in Hobby. 500 total Reds – 330 Reds in Hobby = 170 Reds in Retail * 4,404 odds in retail = 748,680 Total Retail packs.
- Artist Autographs 560,000 Hobby packs / 2,432 odds = 230 Autos in Hobby. 500 total Autos – 230 Autos in Hobby = 270 Autos in Retail * 2,453 odds in retail = 662,310 Total Retail packs.
Uh oh, we have a problem. Take a look at the bold, total retail pack numbers above. The Green, Purple, Orange, and Red numbers all all fairly close. So why are the Super numbers so high, and the Auto numbers so low? Honestly, I have no idea. That’s too big of a different to just be rounding. The odds have to be off somewhere by Topps. So what number should we use for retail packs? I’d feel comfortable using something in the 700k range since the majority of parallels came out in that range. We are going to go with 750,000 for the retail pack number. Just know there’s a chance it’s anywhere between 660k and 880k. The 750,000 number remember, is counting Fat packs as 3 retail packs. Unfortunately, we are unable to breakout the Fat pack production from the Blaster production. We would have to have a card type exclusive to the pack type in order to do that. So all we can figure out is the total retail production.
Now we know the total production numbers. Let’s take a look and compare it to previous Chrome releases. While, I didn’t do a complete deep dive into Chrome 1 & 2 numbers, I did figure out production numbers using Superfractor and Gold Refractor odds.
- Total Production
- Chrome OS 1 – 1,096,370
- Chrome OS 2 – 513,260
- Chrome OS 3 – 1,310,000
- Hobby Pack Production
- Chrome OS 1 – 407,000
- Chrome OS 2 – 71,500
- Chrome OS 3 – 560,000
- Retail Pack Production
- Chrome OS 1 – 689,370
- Chrome OS 2 – 441,760
- Chrome OS 3 – 750,000
As you can see Chrome OS 3 easily tops both previous Chrome sets in all categories. The production rivals OS 1, which was grossly over produced at the time, as Topps misread demand for the product. The difference now could be as simple as demand for GPK is much higher than it was in 2013. We won’t know for sure until a few months down the road, and we can see if unopened product dries up, or prices tank. Chrome OS 3 pack production also passes pack production of the recently released 2020S2 35th Anniversary set.
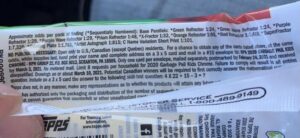 Usually there is a second part to this production review going over unnumbered parallel and insert print runs. Sadly, because we can not break out the pack production between Fat Packs and Blasters with Chrome OS 3, we are unable to accurately determine the number of Atomic Refractors, regular Refractors, and C Name Variations. So let’s do some wild speculation, and try to get a roundabout idea how many of each there are. In the 35th Anniversary release the Blaster to Fat Pack ratio was roughly 3:1. So I’m going to use that same logic here. Our retail pack production number is 750,000. If we say there are 100,000 Fat packs, that’s equal to 300,000 of our production number. That leaves 450,000 Blaster packs. Historically, there are always significantly more Blasters than Fat packs, so I feel pretty good about the numbers. Just keep in mind, this is the wild speculation portion of the article. I normally wouldn’t try to go this far to guess production, but a number of collectors have inquired about C cards. Just know the numbers below are just getting us a ballpark number, but it shouldn’t be that far off of an actual number.
- C Name Variation – 560,000 Hobby pack + 450,000 Blaster packs + 100,000 Fat packs / 101 odds = 10,990 total C cards / 50 cards in set = 219 each C Name Variation.
- Refractors – (560,000 Hobby Packs / 3 odds) + (450,000 Blaster Packs / 5 odds) + (100,000 Fat pack Refractors @ 1 per pack = 376,666 Total Refractors / 100 cards in set = 3,766 each regular Refractor
- Atomic Refractors – 450,000 Blaster packs / 5 per box = 90,000 total Blaster boxes * 3 Atomics per box = 270,000 total Atomics / 100 cards in set = 2,700 each Atomic Refractor.
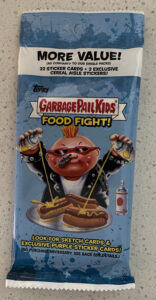
The bottom line is Topps has been running the presses overtime for GPK the last few months. No wonder both recently released sets were delayed! Garbage Pail Kids Chrome OS 3 is the largest produced set since Topps began using odds and numbering cards for GPK. We can’t figure out production for OS, ANS, or Flashback sets. Since Flashback however, this is the largest produced set. Is this the new normal for GPK? The last two releases have seen production numbers unlike anything seen on over 10 years. However, 2020 has seen an increase for the collectibles market across the board. I saw a comment on the Blowout Card Message Boards from someone who was a seasoned card collector, but new to GPKs. He was impressed that GPK Chrome OS 3 wasn’t overproduced. So, its all a matter of perspective. GPK has for many years been a niche product for Topps, but is now starting to move up into the big boys category. The question is, can this demand continue into 2021 with the next retail release 2021S1 Food Fight?
Finally, can we figure out how many base cards were produced? Not really, but we can use what we know and give it our best guess! From breaks I’ve seen about 13-14 packs per hobby box have some sort of parallel. It seems retail is slightly less as often. So let’s use 3.5 base cards per pack as an average.
Base Cards – 1,310,000 total packs * 3.5 base cards per pack = 4,585,000 Total Base Cards produced / 100 cards per set = 45,850 Total of each base card.
That’s 10,000 more base sets than the 35th Anniversary set!!! Just how much are people trying to charge for sets?
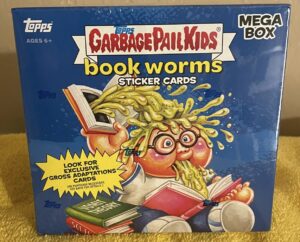
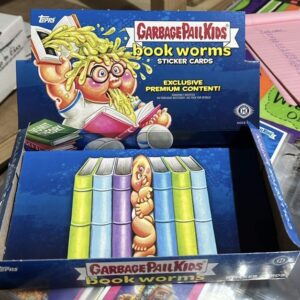 It’s been 519 days between releases of a retail Garbage Pail Kids set. During Covid the popularity of trading cards exploded, causing printer and card stock shortages. After months and months of waiting, Collectors finally get a new set to bust, just not the one they were expecting. Perhaps GPK collectors wouldn’t even have a product to bust if it wasn’t for a contract Topps signed with Walmart for a new type of exclusive Mega Box. Topps had to hit the release date of Book Worms to meet the contract. This caused two sets, 2021S2 Vacation and 2021 Chrome 4, to be temporarily skipped for the first set of 2022. It also caused Topps to cancel the popular Value “Blaster” boxes due to what they said was a shortage of sticker stock. The set itself is the first under new GPK Brand Manager Mark Cruz. Returning are the familiar final card artists; David Gross, Joe Simko, Brent Engstrom, and Joe McWilliams. The familiar 200 card base set formula returns, 100 new pieces with a/b names. In another Topps long tradition, is the return of “Topps math”. Once again the odds on the parallels are overstated by double. Despite reported sticker shortages by Topps, production has increased significantly over the previous 2021S1 Food Fight set. I’ll have articles in the coming days going over productions numbers.
