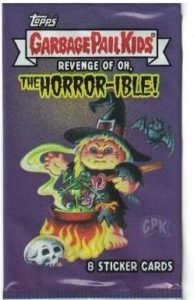
This is Part 2 of a two part series on the production of 2019S2 GPK Revenge of Oh the Horror-ible. If you missed Part 1 you can go here to catch up.
 In the first post we looked at how many packs/boxes/cases were produced of 2019S2 Garbage Pail Kids Revenge of Oh the Horror-ible. Here’s a review of what we came up with.
- Total Production – 748,000 Packs
- Collector – 69,000 Collector Packs or about 2,875 Hobby Boxes or about 360 Collector Cases
- Blaster – 264,000 Blaster Packs or 32,800 Blaster boxes or 1,320 Blaster Cases
- Fat Packs – 130,000 Fat Packs or 1203 Fat Pack cases
- Retail Display – 24,000 Retail Display Packs or 1000 Retail Display boxes or 125 Retail Display Cases
I’ll be using these numbers to try to come up with an idea how many of each type of parallel and insert were created for the set. This will give you a good idea how rare a set is and how quickly you need to snap up that card for your rainbow! I’ll also compare some of this info to the previous sets for reference. As a reminder, in addition to using the sell sheet and odds, we will also have to make some assumptions and flat out guesses when trying to figure some of these out.
So how many of each type of card was made? We can’t figure it out for every type of insert or parallel. Some card types we don’t have enough information. Other times however, Topps is nice enough to tell us exactly how many of a card was produced. Like previous sets, Topps has continued to number many card types. This means we already know most of the parallel and insert numbers already! Makes this post a lot easier! We know Blue /99, Red /75, and Gold /50 for the parallels, and Relics /100 and Autos /25 for the insert sets!
Like with last series because we’ve figured out roughly what the individual pack production is of the various retail packs types we can try to figure out the production of the retail parallels. We can also figure out the Blacklight production.
First let’s figure out production for the various parallels.
- Blacklight – 69,000 Collector packs / 1 Odds (doh) = 69,000 total Blacklight cards / 200 cards in set = 345 per card.
- Green Borders – 264,000 Blaster packs + 130,000 Fat Packs + 24,000 Retail Display Packs / 1 Odds (doh) = 418,000 total Green borders / 200 cards in set = 2090 per card.
- Purple Borders – 130,000 Fat Packs * 2 Per pack = 260,000 total Purple borders / 200 cards in set = 1300 per card
- Yellow Borders – 24,000 Retail Display packs / 4 Odds = 6000 total Yellow borders / 200 cards in set = 30 per card
 Some notes on changes to the parallels this series. Topps messed up on the Fat packs this time. In the past they came with 2 green borders and 1 purple border. This series it was swapped, 2 purples per fat pack, and only 1 green border. So despite production being way up on the set overall the Green parallel production is only slightly up vs. the last set. Conversely, the packet issue with purples in fat packs, coupled with increased production means Purple production is almost triple the previous set. Blacklight cards are up 100 more then Bruised due to production increases as well. With the yellow borders we see a different story. Because there appears to be a decrease in Retail Display boxes the yellows might be as low as only 30 of each card produced. Except this to be up sharply as yellows more to Value boxes for 2020S1.
Now let’s take a look at the various insert sets.
- Horror Film Posters – 69,000 Collector packs / 24 odds = 2,875 total Horror Film Posters / 9 cards in set = 319 per card
- Classic Monsters – 130,000 Fat packs * 2 per pack = 260,000 total Classic Monsters / 20 cards in set = 13,000 per card
- Horror Victims – 52,800 Blaster Boxes * 3 per box = 158,400 total Horror Victims / 10 cards in set = 15,840 per card
- Trick or Treat – 24,000 Retail Display packs / 3 odds = 8,000 total Trick or Treat / 10 cards in set = 800 per card
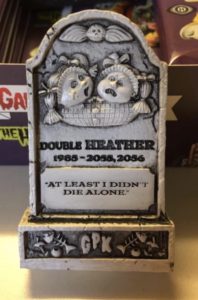
- Tombstone Figures – 2,875 Collector boxes / 1 odds – 2,875 total Tombstone figures / 12 figures in set = 240 per figure
While production was way up, some of the insert set changes helped keep production runs for the inserts only slightly higher than previous sets. Set sizes for Posters, Horror Victims, and Trick or Treats kept the numbers in line with previous releases. While I know it doesn’t seem like it for some of the Tombstone figurines, there are a good number of each available. Topps choosing to pack each case with the same figures certainly doesn’t help collectors in making the set.
One thing I like taking a look at each set is where all the printing plates are hiding. Historically, retail has the majority of the printing plates because it accounts for over 80% of the print run. One other thing these numbers will tell us is how close we are to having correct retail pack production numbers. We know Topps inserted 440 plates into production. Here is the breakdown of how many can be found in each pack type.
- Collector Plates – 69,000 packs / 462 odds = 149 plates in Collector packs
- Fat Pack Plates – 130,000 packs / 870 odds = 149 plates in Fat Pack packs
- Blaster Plates – 264,000 packs / 2615 odds = 100 plates in Blaster packs
- Retail Display Plates – 24,000 packs / 2653 odds = 9 plates in Retail Display packs
Once again if you want a plate Collector packs are the easiest option. Although a large amount of plates are in retail packs, you just have to open a bunch. The total we get on plates is 407. Which is not bad considering as I mentioned in the last article the packs numbers are probably slightly off on Fat packs and Retail Display packs. Still we are in the ballpark of 440. Which makes me feel good that we are close on production numbers.
 Topps is seeing popularity for the GPK brand at its highest it’s been in years. A new Brand Manager has started making some long overdue changes to set and card makeup. There will be many more changes coming in the 2020S1 set. The art is better than its even been now that the final card artists have been paired down. There are more merchandise items than ever before with GPK characters on them. The trick going forward for Topps will be to try to balance popularity of the sets, while keeping collectors happy with insertion rates. A huge complaint with this series was around how tough the hits were to pull for collectors. It will be interesting to see how Topps handles that in the next retail set.
Finally, can we figure out how many base cards were produced? Not really, but we can use what we know and give it our best guess! We know Collector packs have 6 or 7 base cards per pack now, except for packs containing patches, but that number is so small we will go with 6. Retail/Hobby packs 7 base cards per pack this time around, except for packs containing gold dust, autos, sketches, and plates, but again that number is so small I’m going to go with 7 per pack.
Base Cards – (69,000 Collector packs X 6 cards per pack) + (679,000 Retail packs X 7 cards per pack) = 5,167,000 Total Base Cards produced / 200 cards per set = 25,835 Total of each base card.
The smaller set size, coupled with high production increases means there are over 10,000 more base sets than the last release. Take your time with this one, there will be base sets of this one around for years to come.
This is Part 2 of a two part series on the production of 2019S2 GPK Revenge of Oh the Horror-ible. If you missed Part 1 you can go here to catch up.

Not sure if I’m the only one but I opened 4 cases of Collector, ended up with almost a even split of 16 & 16 of the same tombstones ,
Nope everyone experienced the same thing sadly.